
Manuel Corona
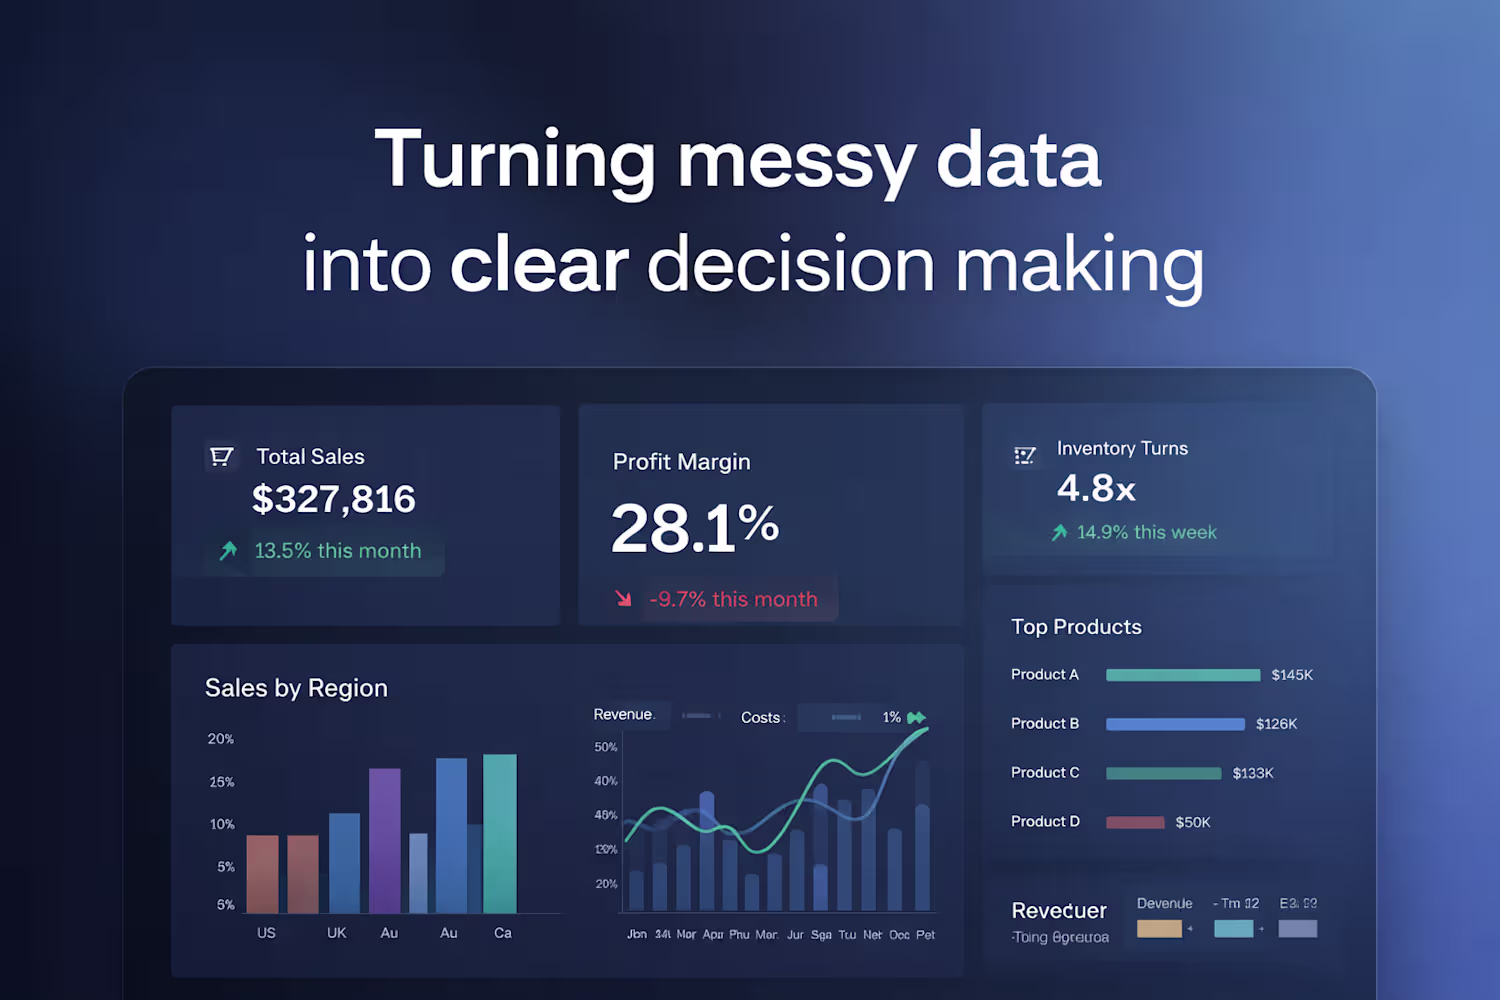
I find where your business is losing money in your data.
New to Contra
Manuel is ready for their next project!
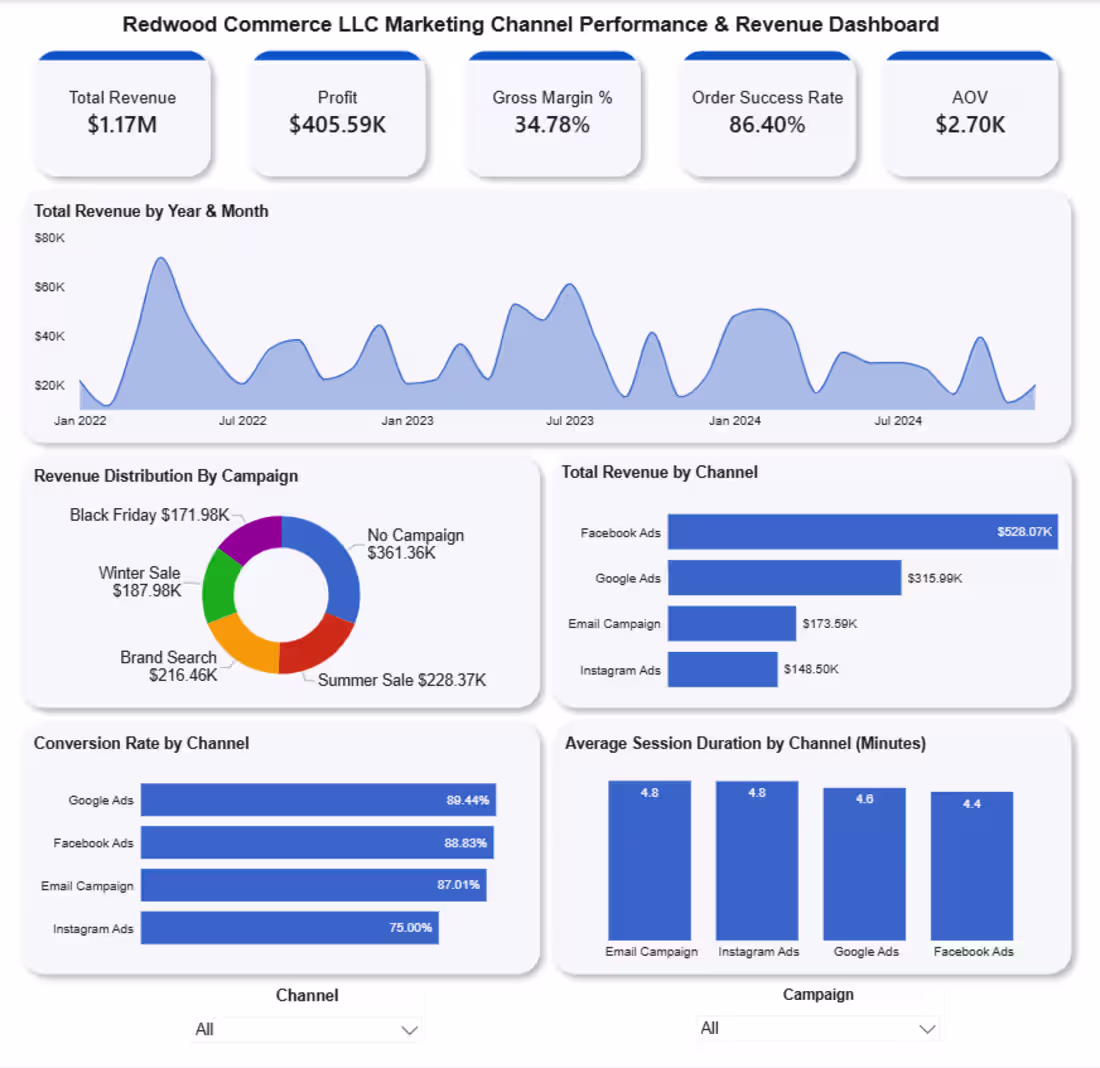
Started with an unstructured Excel dataset. Cleaned and transformed data using Power Query, standardized schema and grain, and built a star-schema semantic model (fact revenue + marketing performance, dimension tables for campaign, channel, and date).
Developed DAX measures for key KPIs (Revenue, Profit, Margin, AOV, Conversion Rate) and delivered an interactive Power BI dashboard for campaign and channel performance analysis.
0
46
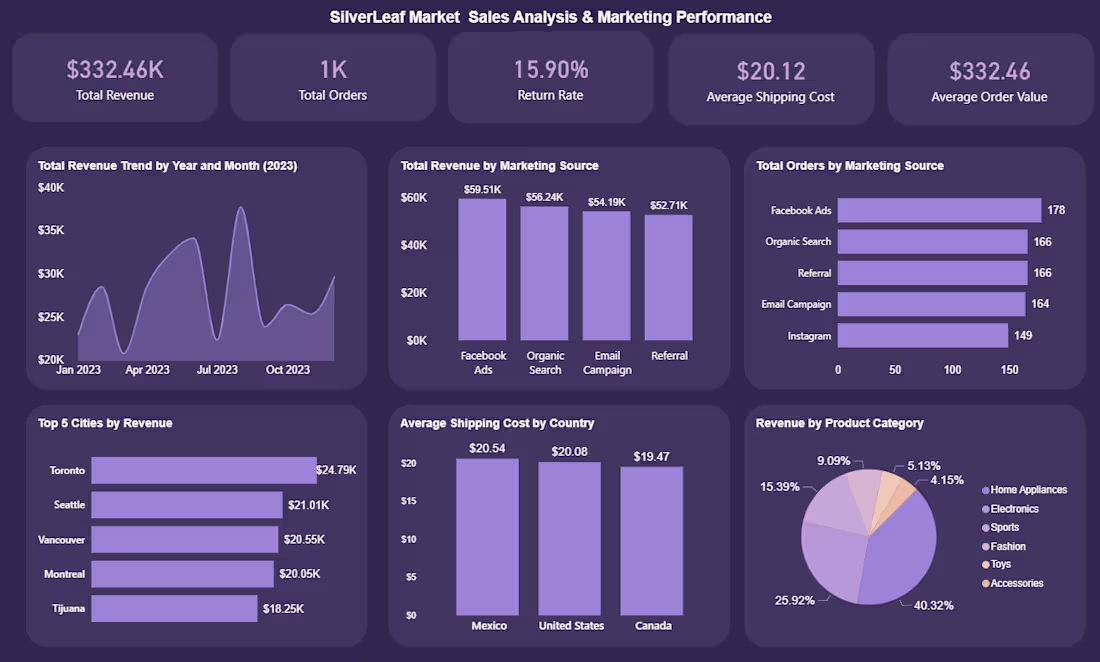
Used SQL for data cleaning, transformation, and normalization across multi-source sales and marketing datasets, building a structured relational model for revenue, orders, channels, and product categories.
Developed DAX measures for key KPIs (Total Revenue, Orders, Return Rate, AOV, and channel performance) and delivered an interactive Power BI dashboard for trend, geographic, and marketing source analysis.
0
52
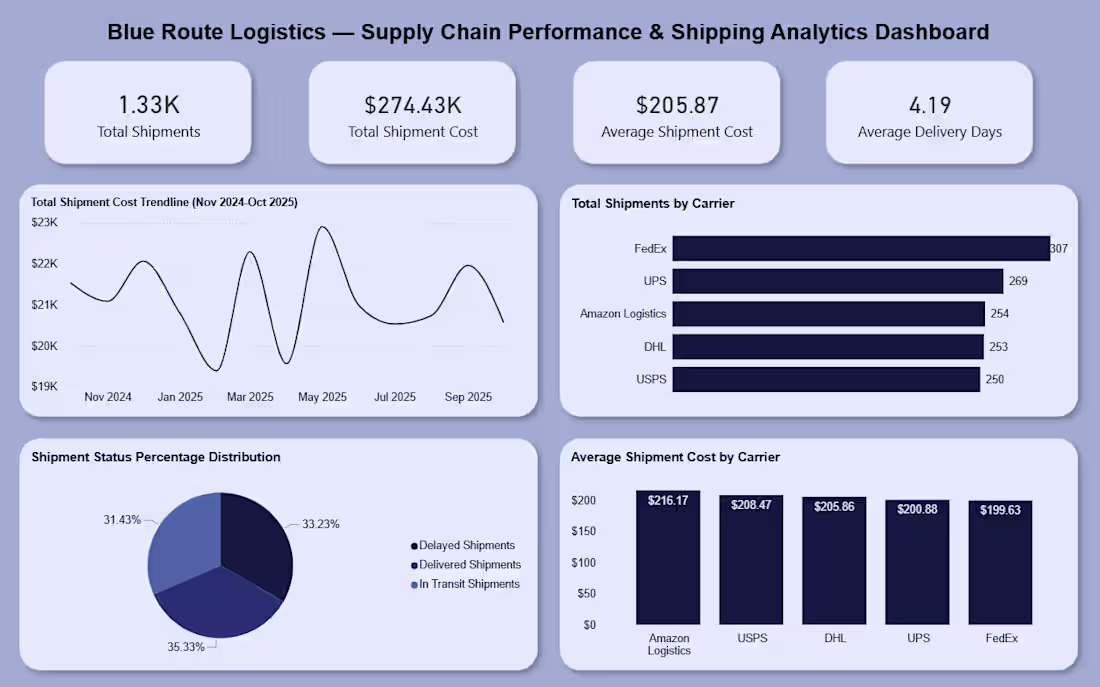
Cleaned and structured logistics and shipping data using SQL, standardizing shipment records, carrier information, and cost fields to ensure consistency across sources.
Built a relational model to analyze shipments, delivery performance, and carrier efficiency, and developed DAX measures for KPIs such as total shipments, shipping cost, average shipment cost, and delivery time.
Delivered an interactive Power BI dashboard to monitor logistics performance, compare carriers, and identify cost and delivery optimization opportunities.
0
41
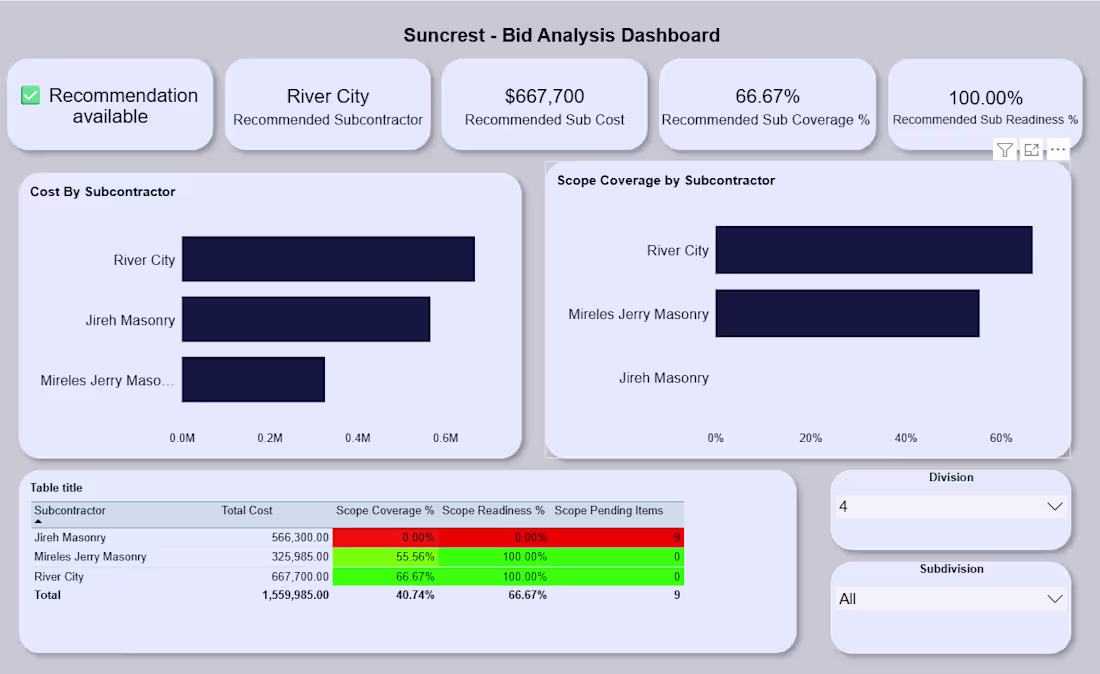
Structured and modeled subcontractor bid data to evaluate cost, scope coverage, and readiness across vendors for a $25 million dollar construction project.
Built a relational model, cleaned data with Python Pandas, and DAX measures to calculate total cost, coverage %, readiness %, and pending scope items, enabling comparative analysis between subcontractors.
Delivered a Power BI dashboard to support bid evaluation, vendor selection, and decision-making based on cost efficiency and scope completeness.
0
44