
Malik Hassan
1. Aspiring Data Analyst | Python | SQL | Excel | Power BI
- 3
- Followers



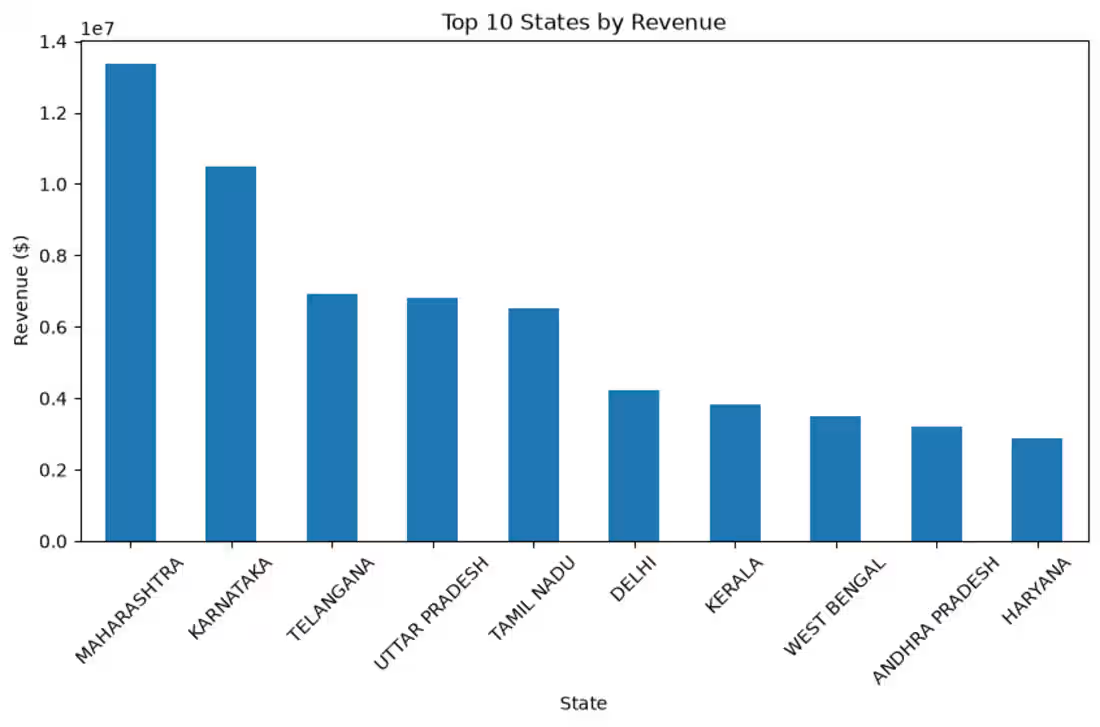
Visualized sales trends, revenue, and order performance using interactive Power BI charts.
Built interactive charts to analyze sales, product categories, and order status.
Created dynamic dashboards with KPIs, line charts, pie charts, maps, and slicers for business insights.
Designed interactive Power BI visuals to track sales performance and support data-driven decisions.
Developed insightful charts to monitor revenue trends, top-selling products, and regional sales performance.
0
45
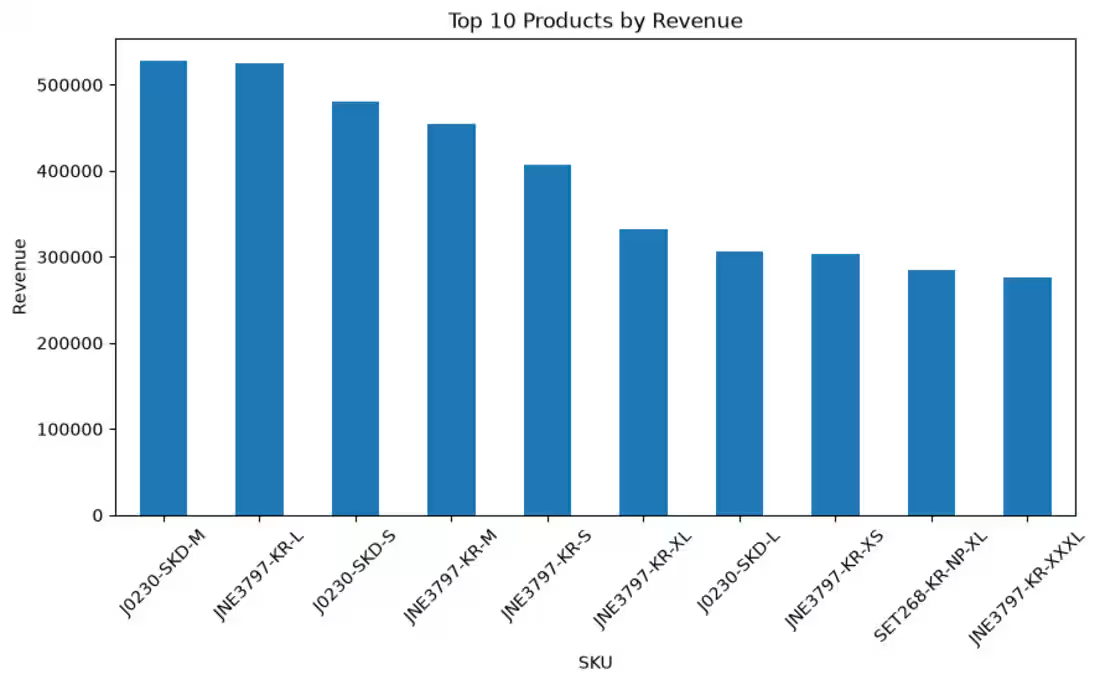
Visualized sales trends, revenue, and order performance using interactive Power BI charts.
Built interactive charts to analyze sales, product categories, and order status.
Created dynamic dashboards with KPIs, line charts, pie charts, maps, and slicers for business insights.
Designed interactive Power BI visuals to track sales performance and support data-driven decisions.
Developed insightful charts to monitor revenue trends, top-selling products, and regional sales performance.
0
42
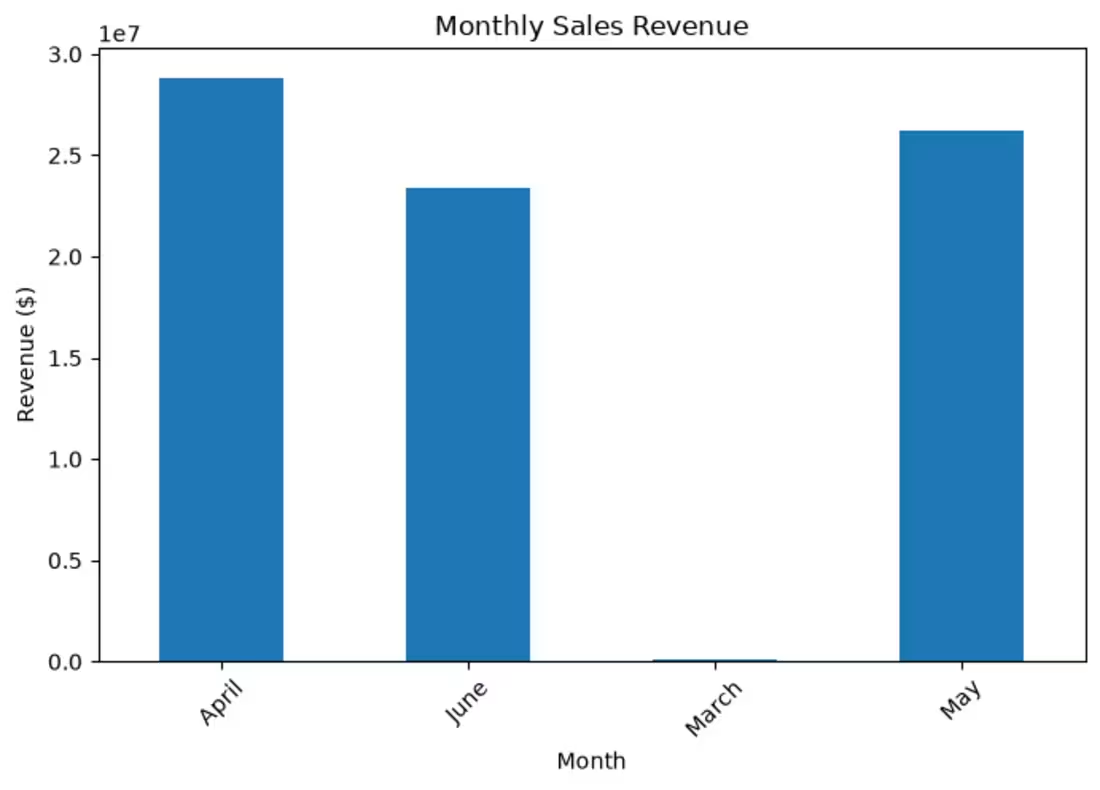
Visualized sales trends, revenue, and order performance using interactive Power BI charts.
Built interactive charts to analyze sales, product categories, and order status.
Created dynamic dashboards with KPIs, line charts, pie charts, maps, and slicers for business insights.
Designed interactive Power BI visuals to track sales performance and support data-driven decisions.
Developed insightful charts to monitor revenue trends, top-selling products, and regional sales performance.
0
40
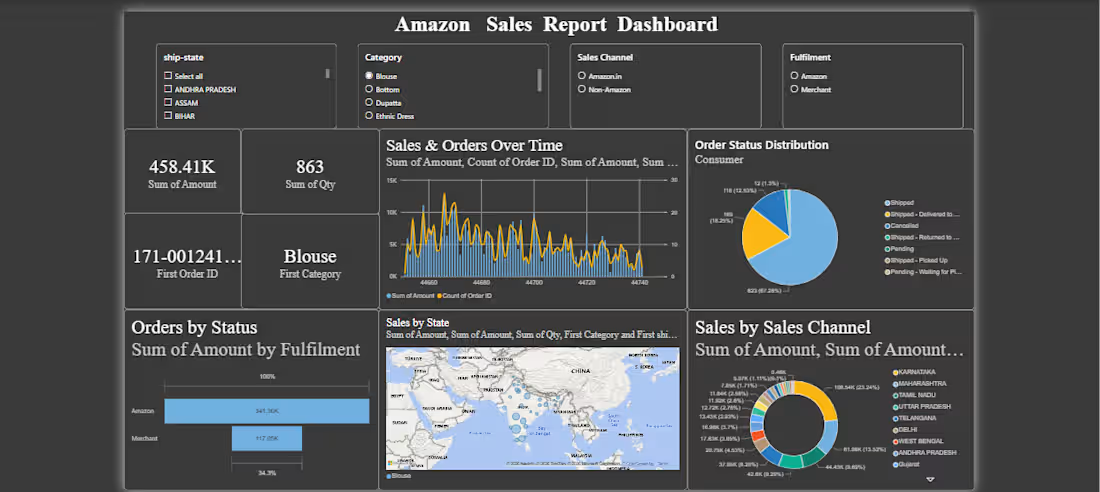
Developed an interactive Amazon Sales Dashboard in Power BI to analyze sales trends, revenue, product performance, and key business KPIs using Python, SQL, and Excel.
1
149