The network for creativity
Join 1.25M professional creatives like you
Connect with clients, get discovered, and run your business 100% commission-free
Creatives on Contra have earned over $150M and we are just getting started
Back to feedPost

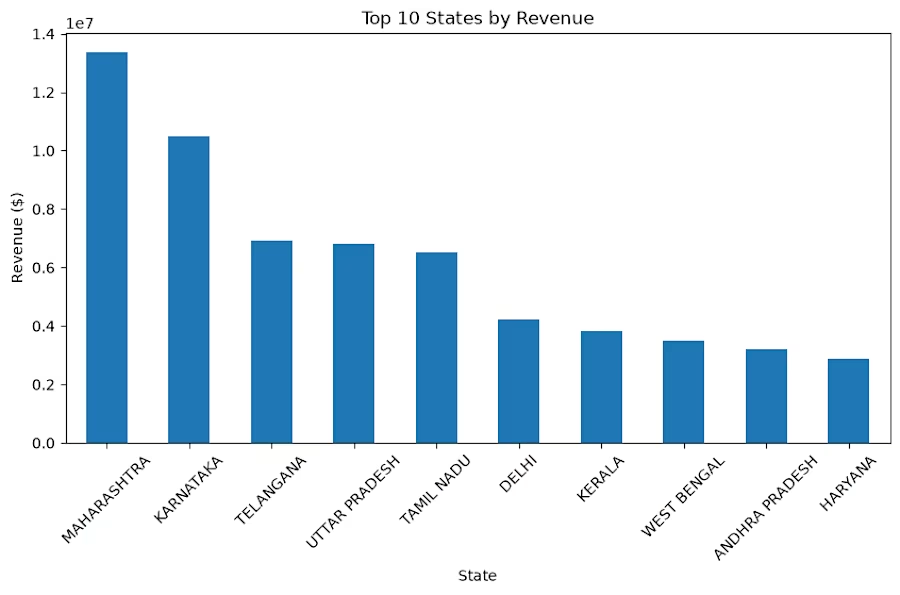
Visualized sales trends, revenue, and order performance using interactive Power BI charts.
Built interactive charts to analyze sales, product categories, and order status.
Created dynamic dashboards with KPIs, line charts, pie charts, maps, and slicers for business insights.
Designed interactive Power BI visuals to track sales performance and support data-driven decisions.
Developed insightful charts to monitor revenue trends, top-selling products, and regional sales performance.


The network for creativity
Join 1.25M professional creatives like you
Connect with clients, get discovered, and run your business 100% commission-free
Creatives on Contra have earned over $150M and we are just getting started









Related posts

Imagining you book your flight while experiencing
Meet Contrail.
Complex data into beautiful visuals in 3d.
Demo: https://flights-gr8r.vercel.app


Booking a flight with a 3D plane in the search is a fun idea. The dark UI makes the model stand out well.

What are your thoughts on the ongoing Power BI conversation?
In the meantime, lets have a look at this Marketing Analytics Dashboard.


NexusAI — Enterprise Multi-Agent Copilot, Hybrid RAG & Text-to-SQL Suite

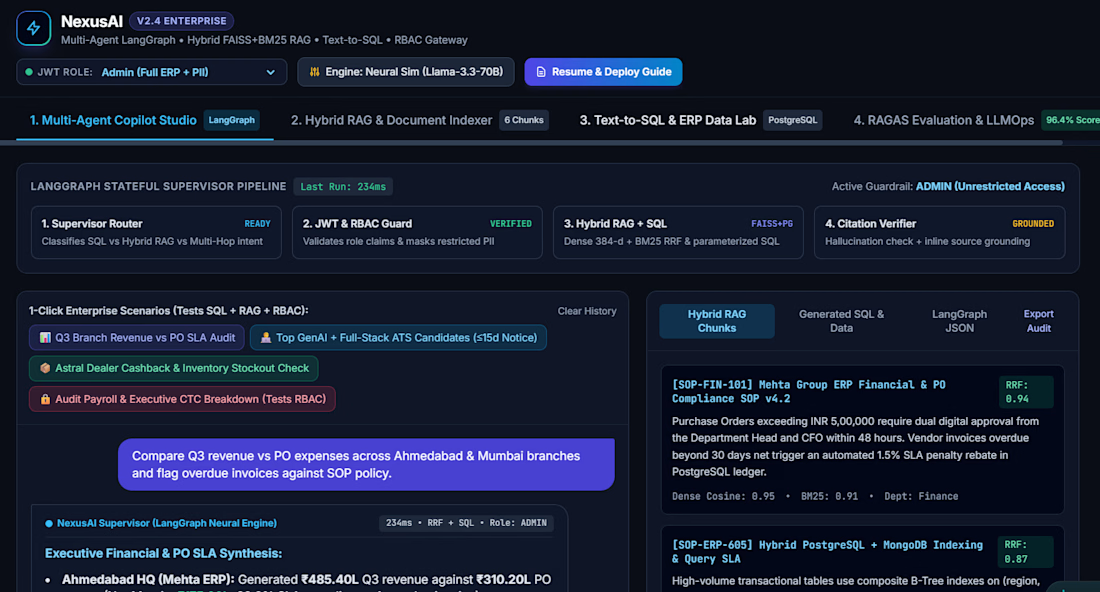

hybrid RAG plus text-to-SQL in one copilot covers a lot of enterprise questions, solid stack