
Mahmoud Ashry
Data Architect & OCI Expert | Medallion Data Warehouses
New to Contra
Mahmoud is building their profile!
Project Title:
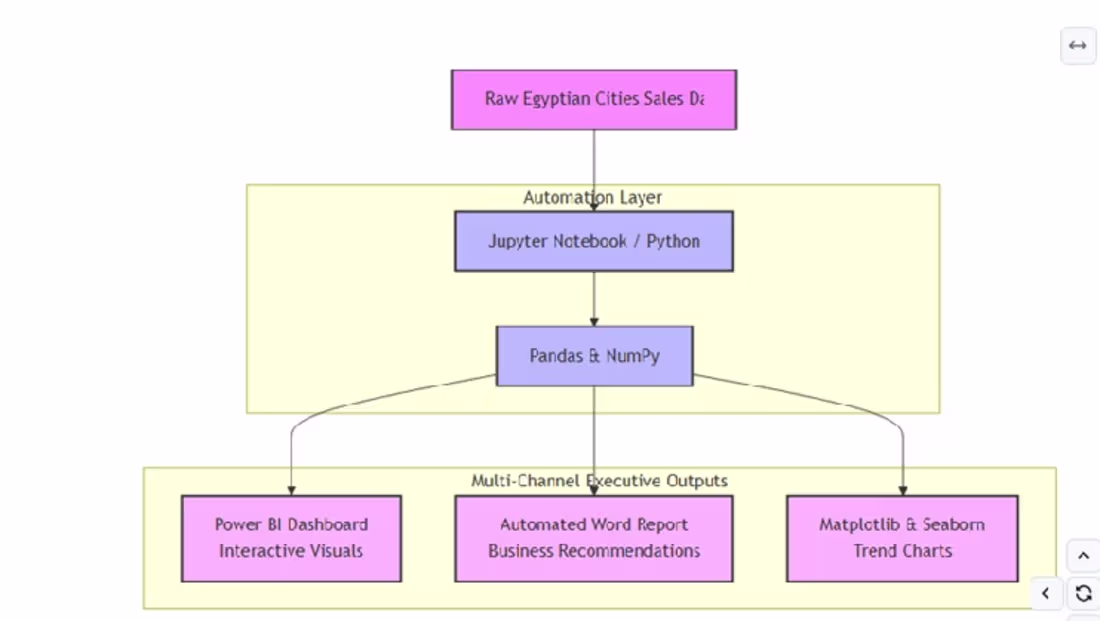
Regional Sales Performance & Automated Executive Reporting
Project Description:
An automated data analytics platform designed to evaluate and track regional sales performance, revenue trends, and customer behavior across multiple Egyptian cities. This solution bridges raw transaction logs with automated business intelligence insights.
Key Business Metrics Analyzed (Auto-Generated):
• Total Revenue Evaluated: 10,547,450 EGP
• Total Profit Captured: 2,824,025 EGP
• Top Performing Region: Mansoura
• Top Growth Category: Electronics
• Peak Seasonal Trend: October (2024-10)
Core Tech Stack & Tools Used:
• Data Processing & Automation: Python, Pandas, NumPy, Jupyter Notebook
• Data Visualization: Matplotlib, Seaborn
• Executive Outputs: Power BI Dashboard, Automated Microsoft Word Business Reports
Key Achievements & Recommendations:
• Engineered Python scripts to dynamically calculate top revenue-generating channels and geographical performance indicators.
• Created a multi-channel reporting structure providing interactive Power BI exploration alongside automated C-suite Word reports.
• Delivered strategic data-driven recommendations, successfully identifying Mansoura and the Electronics segment as the primary drivers for future marketing and inventory allocation.
1
20
Project Title:
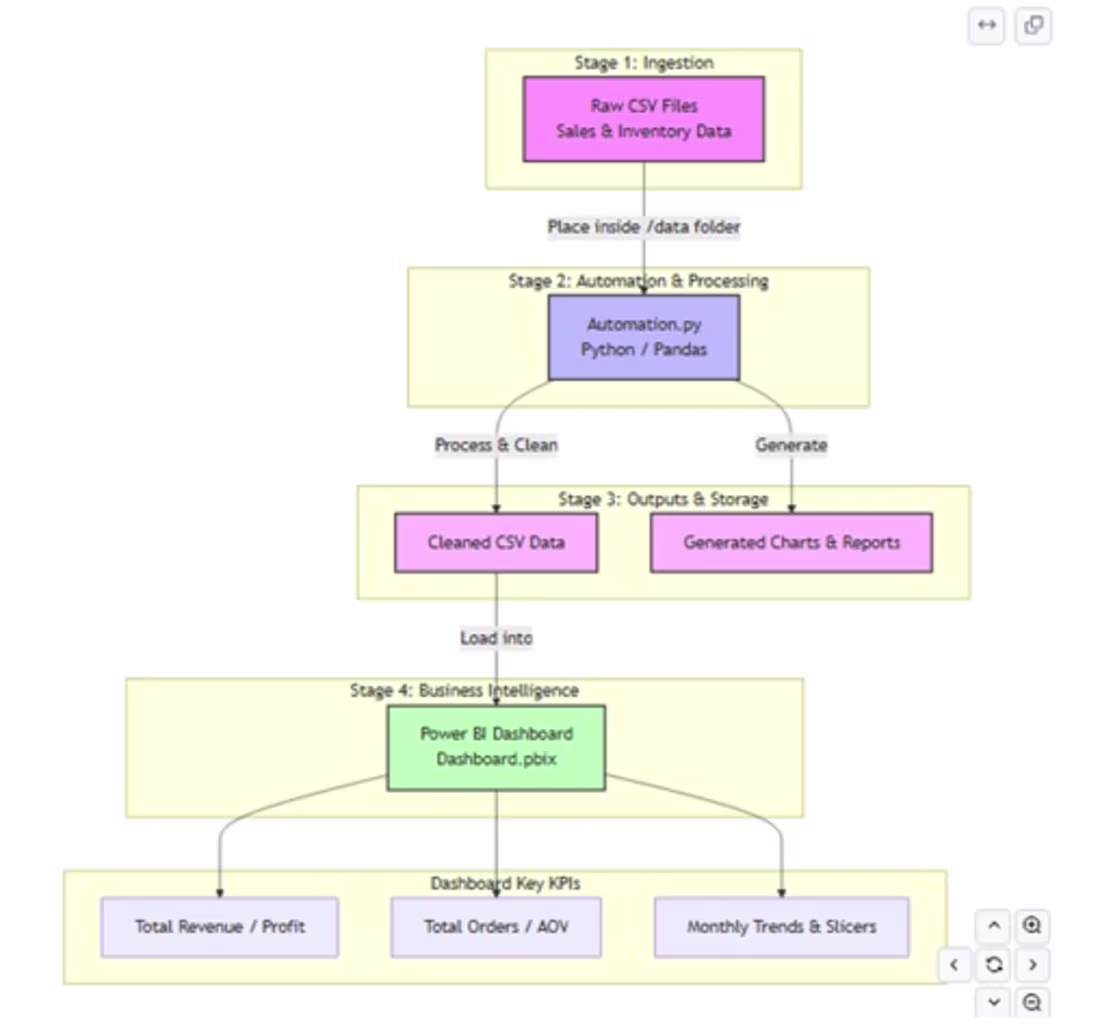
E-Commerce Data Pipeline & Inventory Analytics – SmartShop
Project Description:
Developed and deployed an end-to-end automated data ingestion and inventory analytics pipeline tailored for e-commerce platforms. This project bridges the gap between raw data automation and executive decision-making.
Core Business Questions Answered:
• Identification of highest-profit generating product categories.
• Analysis of monthly revenue and margin trends.
• Tracking and ranking top customers by total sales volume.
Core Tech Stack & Tools Used:
• Ingestion & Automation: Python (Automation.py (http://Automation.py)), Pandas, Jupyter Notebook
• Data Visualization & Outputs: Matplotlib Charts, Cleaned CSV Datasets, Business Reports
• Analytics & BI: Power BI Dashboard (Dashboard.pbix) with Interactive Slicers
Key Deliverables & Highlights:
• Automated Pipeline: Built robust Python scripts to seamlessly ingest, process, and clean raw sales and inventory CSV data.
• Interactive Dashboard: Created an executive Power BI dashboard tracking critical KPIs including Total Revenue, Total Profit, Total Orders, and Average Order Value (AOV).
• Granular Insights: Enabled dynamic revenue breakdown by City and Category using interactive date, city, and category slicers to support strategic data-driven business decisions.
1
24
Project Title:
Advanced Data Warehouse Optimization – SalesPilotDW (Phase 2: Denormalization)
Project Description:
Built directly upon the core infrastructure established in Phase 1, this phase focuses on advanced data warehouse refactoring and high-performance denormalization to optimize the analytical layer for enterprise business intelligence.
Core Tech Stack & Tools Used:
• Analytics & BI: Power BI (Executive Dashboards with Row-Level Security applied)
• Databases & Optimization: PostgreSQL, SQL Server (ARM-based OCI Ampere A1 Migration)
• Infrastructure & Monitoring: Python ETL, Telegram API Alerts & Logs
Key Evolutionary Enhancements & Achievements:
• Strategic Data Denormalization: Restructured over 18 complex normalized tables from Phase 1 into a high-performance Star Schema (optimized Fact and Dimension tables) to streamline analytical queries.
• Query Performance Tuning: Drastically reduced Power BI dashboard refresh latency and optimized data retrieval speeds through strategic denormalization and database environment fine-tuning.
• Enterprise Security Deployment: Implemented advanced Row-Level Security (RLS) within Power BI to ensure safe, role-based data access for key stakeholders.
1
28
Project Title:
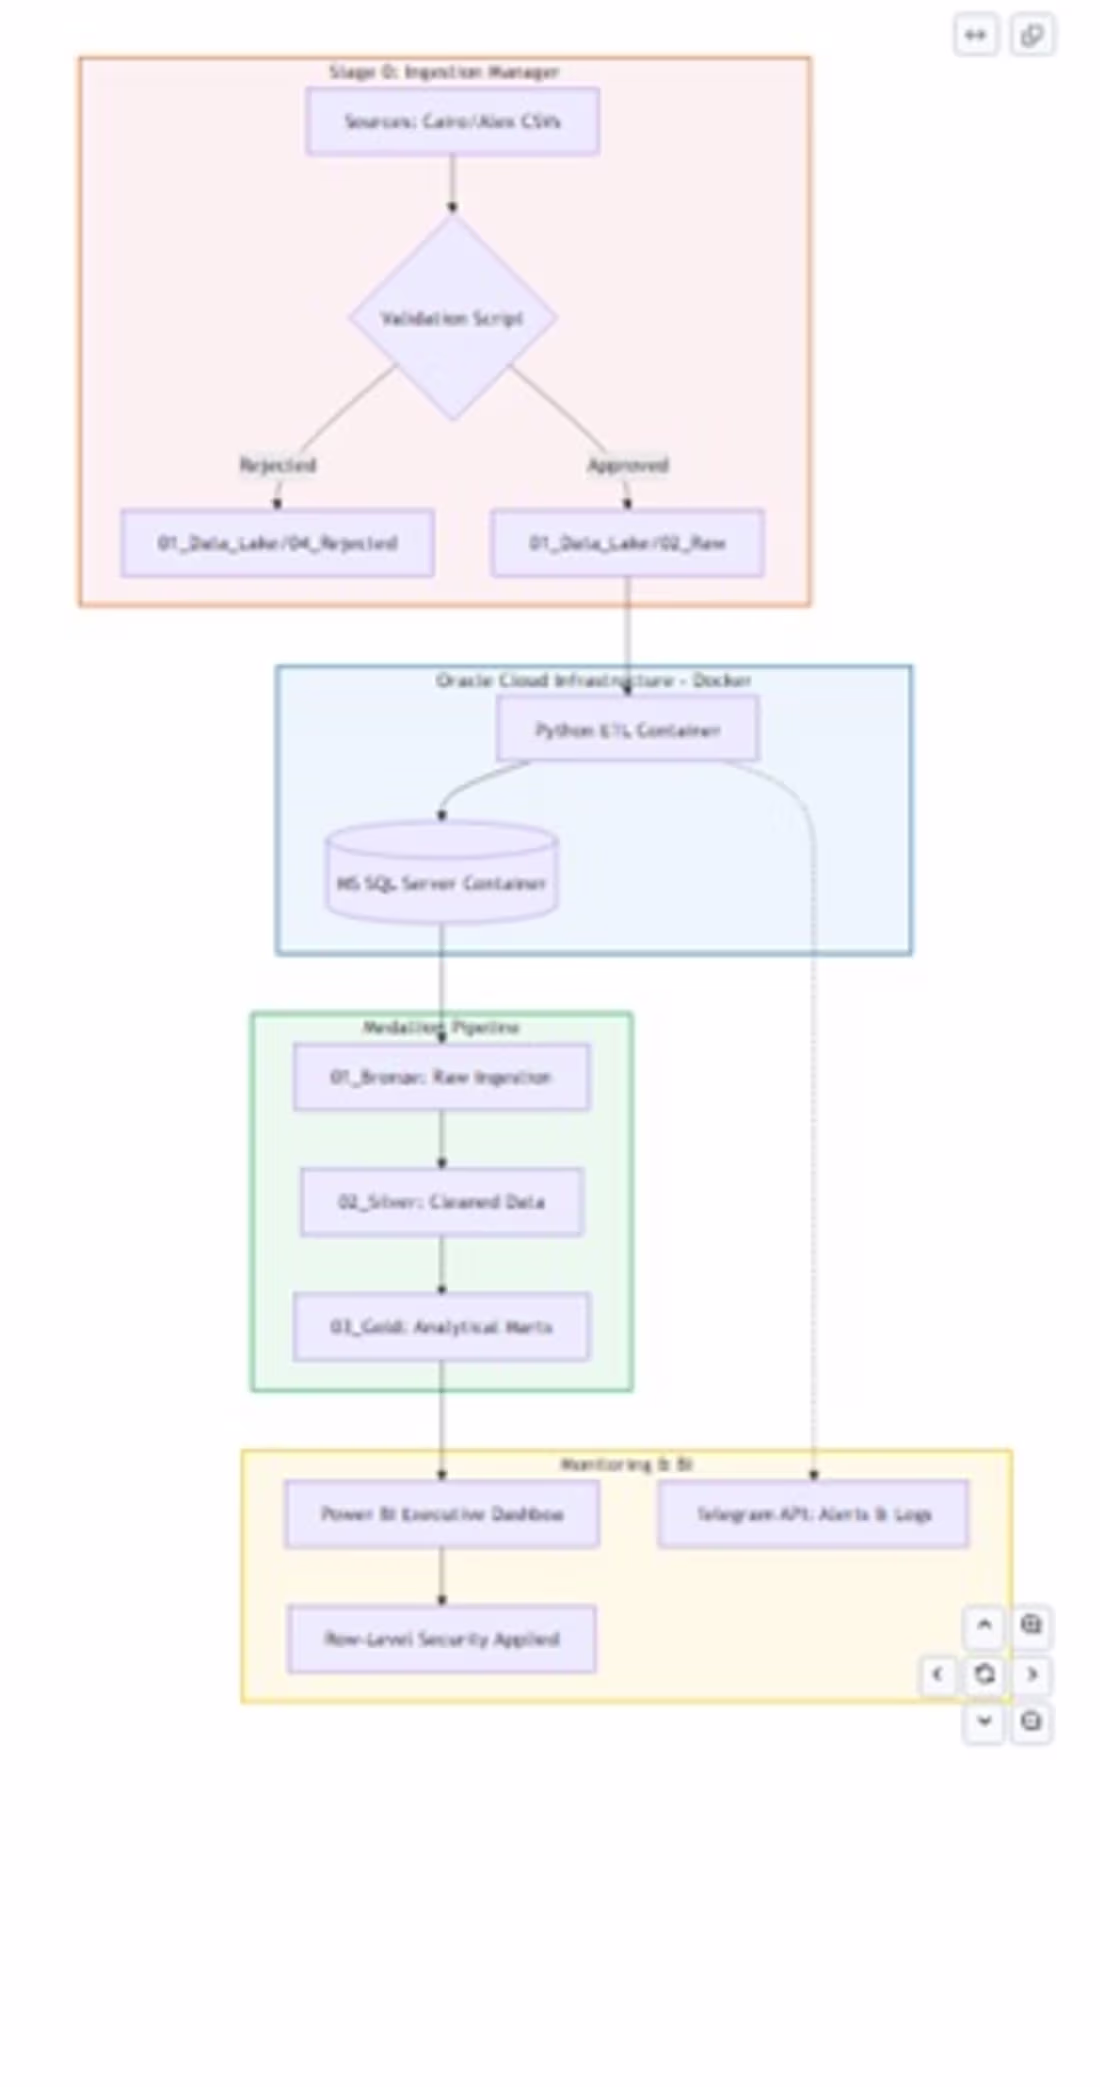
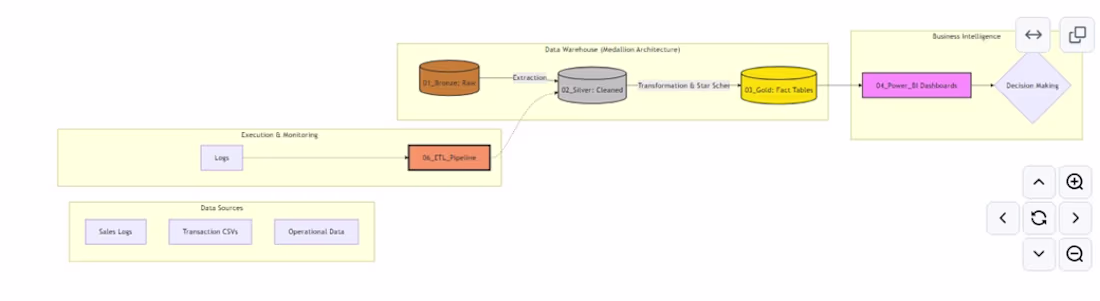
SaaS Data Infrastructure – SalesPilotDW (Phase 1: Foundation)
Project Description:
Architected and deployed the core data platform foundation for a Next-Gen SaaS Sales Intelligence Hub on Oracle Cloud Infrastructure (OCI). This phase focuses on establishing a reliable data pipeline to centralize multi-source enterprise data.
Core Tech Stack & Tools Used:
• Databases: Microsoft SQL Server, PostgreSQL
• Infrastructure & DevOps: Oracle Cloud Infrastructure (OCI), Docker, Linux (Ubuntu/Oracle Linux)
• Data Pipeline: Python, Medallion Architecture (Bronze, Silver, Gold layers), Crontab Automation
Key Achievements:
• Successfully integrated disparate data sources including Sales Logs, Transaction CSVs, and Operational Data into a unified repository.
• Built automated logging, execution tracking frameworks, and integrated a Telegram Bot API for real-time status alerts.
• This foundational system provided a highly reliable data flow, setting the perfect baseline for subsequent advanced performance tuning and denormalization in Phase 2.
1
32