
Sales & Profit Dashboard | Excel
I developed an Excel-based sales and profitability dashboard to demonstrate my skills in financial reporting, data analysis, and business performance tracking.
Project Features:
Automated sales revenue and cost calculations.
Gross profit analysis.
Product profitability and profit margin tracking.
Financial dashboard with key performance indicators.
Product comparison charts.
Organized transaction records.
Tools Used: Microsoft Excel.
Skills: Data Analysis, Accounting, Financial Analysis.
This project demonstrates my ability to organize sales information, calculate business performance indicators, and turn financial data into clear reports for decision-making.
This is a portfolio demonstration using fictional business data.
0
27
Bank Reconciliation Dashboard | Excel
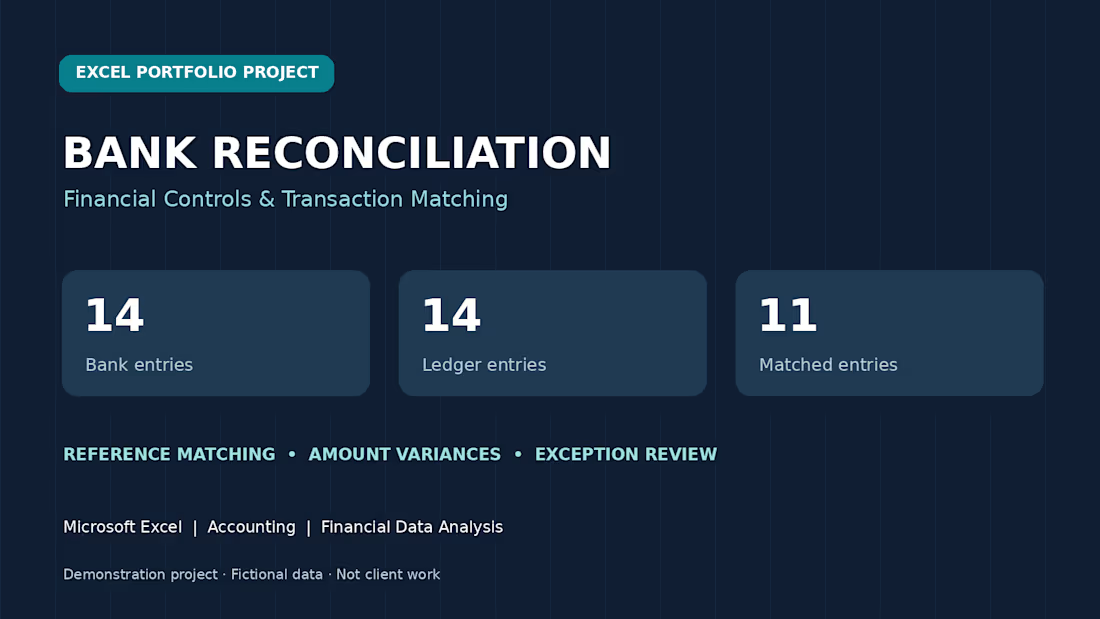
I created an Excel-based bank reconciliation project to demonstrate my accounting, financial analysis, and data management skills.
Project Features:
Comparison of bank statements and accounting records.
Automated transaction matching using Excel formulas.
Identification of missing transactions and amount discrepancies.
Financial dashboard with key reconciliation indicators.
Organized financial records and exception reporting.
Tools Used: Microsoft Excel.
Skills: Accounting, Data Analysis, Financial Analysis, Bank Reconciliation.
This project demonstrates my ability to organize financial transactions, identify discrepancies, and support accurate financial reporting.
This is a portfolio demonstration using fictional business data.
0
23
Income & Expense Control | Excel Dashboard
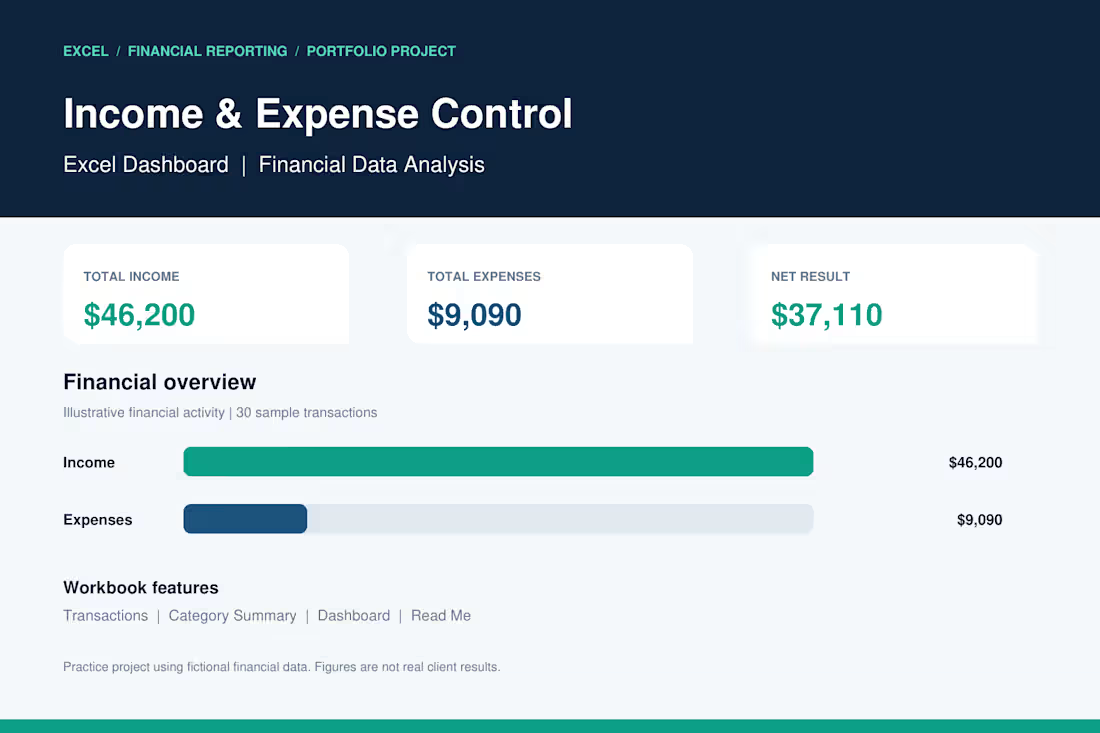
I developed a professional Excel dashboard as a portfolio practice project to demonstrate my skills in financial data management, income and expense tracking, and business reporting.
Project Features:
Automated income and expense calculations.
Financial dashboard with key performance indicators (KPIs).
Transaction tracking and organization.
Expense analysis by category.
Financial charts and visual reporting.
Net income calculation.
Project Results (Sample Data):
Total Income: $46,200
Total Expenses: $9,090
Net Result: $37,110
Tools: Microsoft Excel
Skills: Data Analysis, Accounting, Financial Reporting, Data Entry.
This project demonstrates my ability to organize financial records, analyze business performance, and create clear financial reports using Microsoft Excel.
Note: This is a portfolio demonstration using fictional financial data.
2
3
106
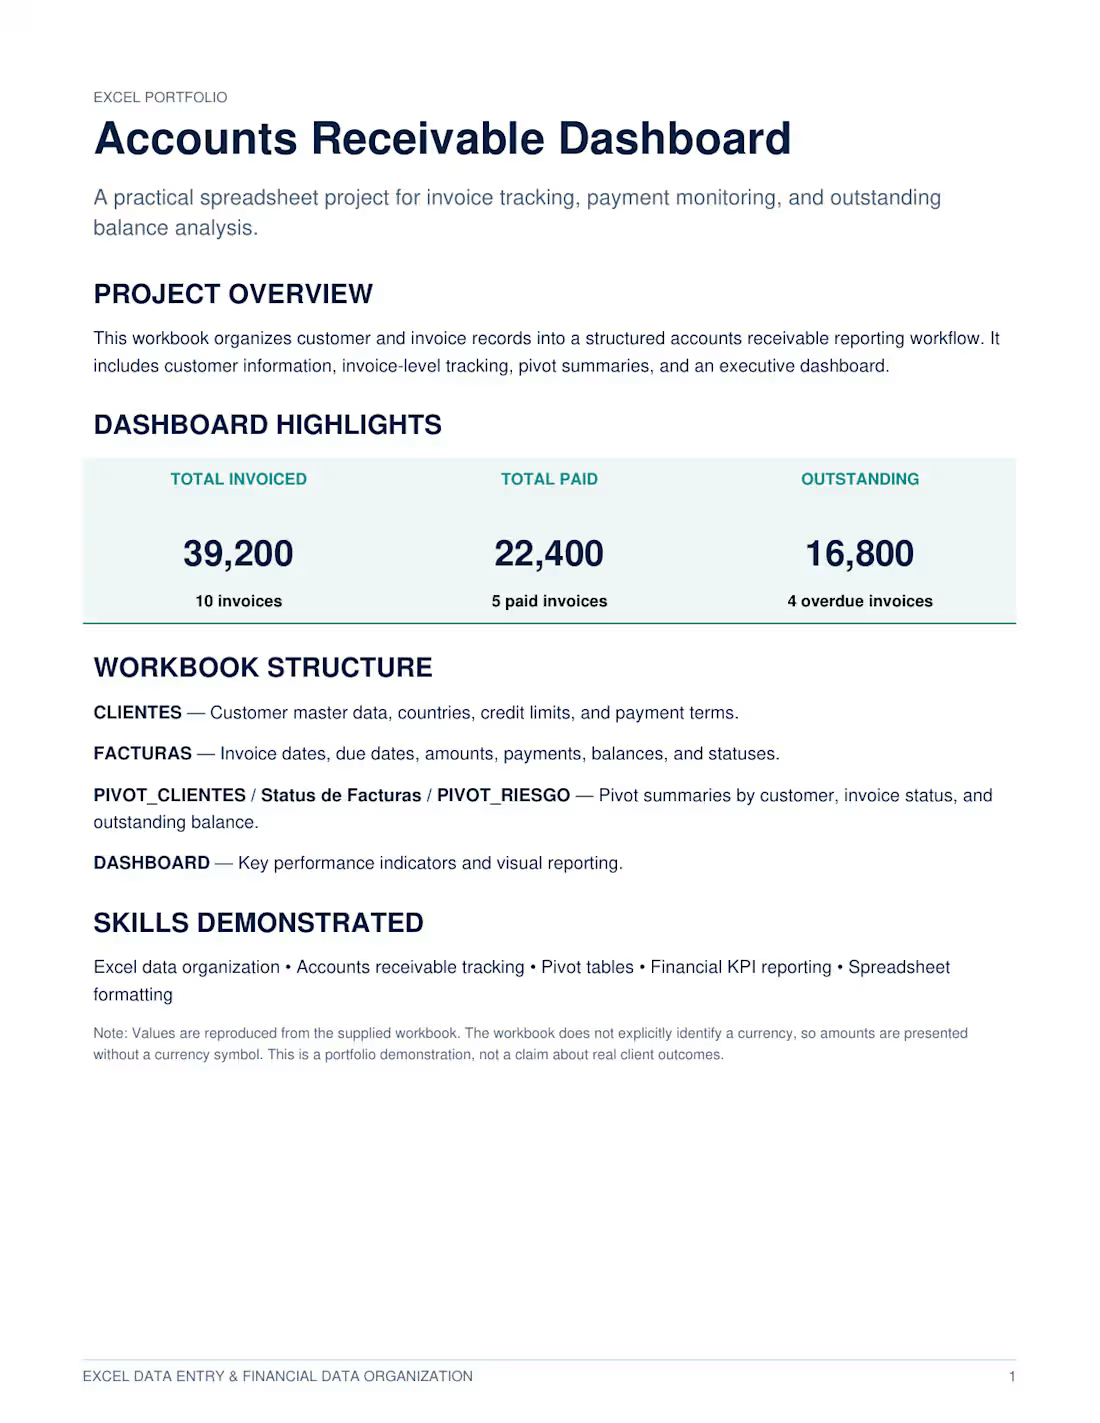
Accounts Receivable Dashboard | Microsoft Excel
I created this Excel dashboard as a portfolio practice project to demonstrate my skills in financial reporting, data organization, and accounts receivable management.
The project includes:
Total invoiced: 39,200
Total payments received: 22,400
Outstanding balance: 16,800
Invoice and customer tracking
Pivot tables and financial reports
Skills: Microsoft Excel, Data Entry, Accounts Receivable, Financial Reporting, and Data Analysis.
This project demonstrates how Excel can help businesses organize financial information and monitor outstanding payments.
0
44