
LASSINE KEITA
Power BI & Excel Expert | Data Analyst | MEAL Specialist
New to Contra
LASSINE is building their profile!

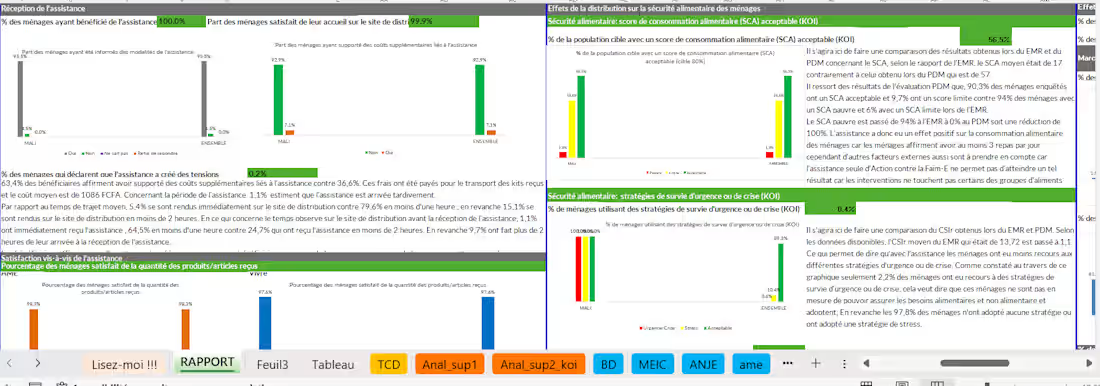
Designed a comprehensive Excel dashboard for MEAL reporting and humanitarian projects. The dashboard includes KPIs, Pivot Tables, charts, food security indicators, automated analysis, and interactive reporting to support data-driven decision-making. All confidential information has been anonymized.
0
13
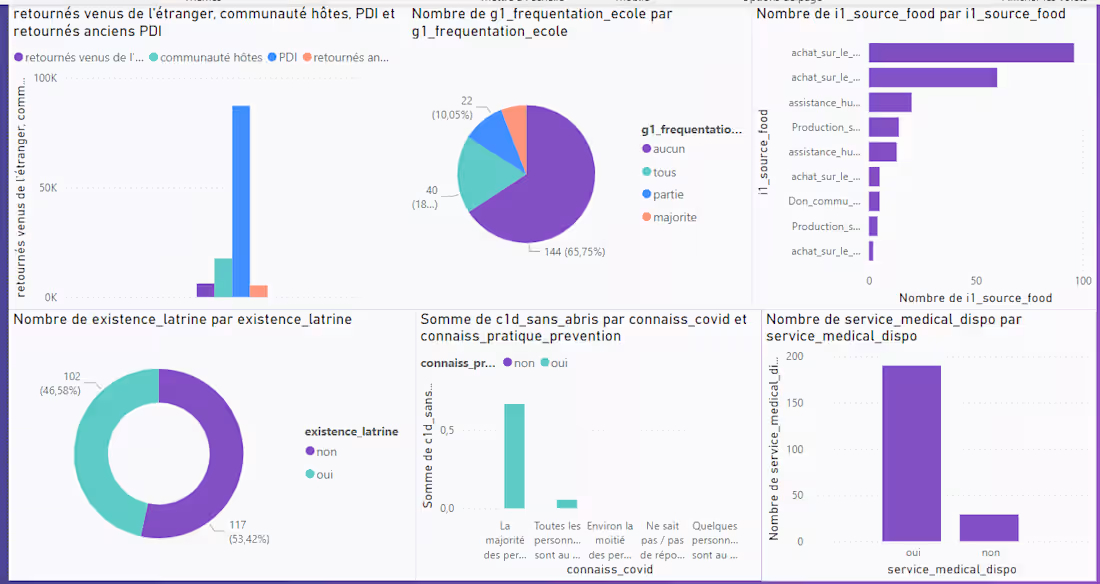
Developed an interactive Power BI dashboard to analyze humanitarian survey data collected through KoboToolbox. The dashboard provides insights into education, food security, sanitation, healthcare access, and displacement status using interactive charts, KPIs, filters, and drill-down analysis. Built with Power Query, DAX, and data modeling to support evidence-based decision-making. All sensitive information has been anonymized.
0
30
Developed an interactive Power BI dashboard to transform raw business data into actionable insights. The dashboard includes KPI cards, DAX measures, Power Query data transformation, dynamic filters, drill-through analysis, trend visualization, and executive reporting. Designed to support data-driven decision-making with a clean and user-friendly interface.
0
28
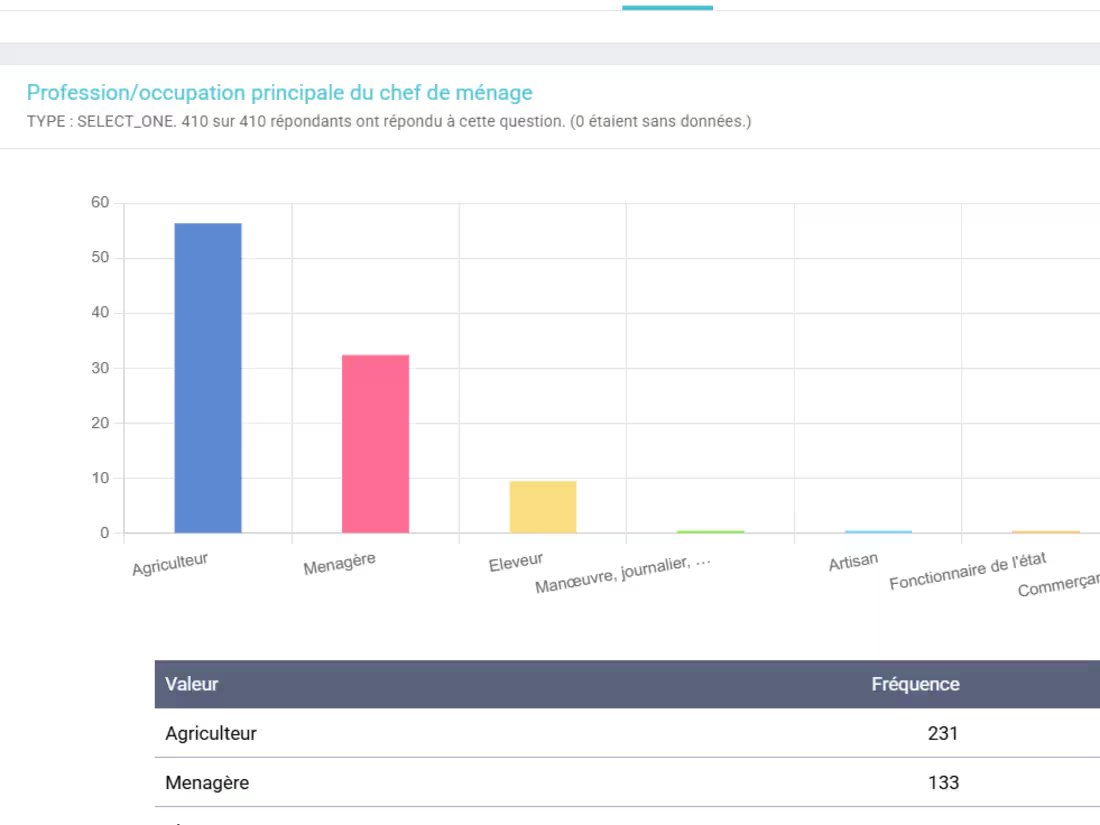
Designed professional digital data collection forms using KoboToolbox and XLSForm for humanitarian and development projects. Implemented skip logic, validation rules, multilingual questionnaires, GPS capture, and automated data collection workflows to ensure high-quality field data.
0
34
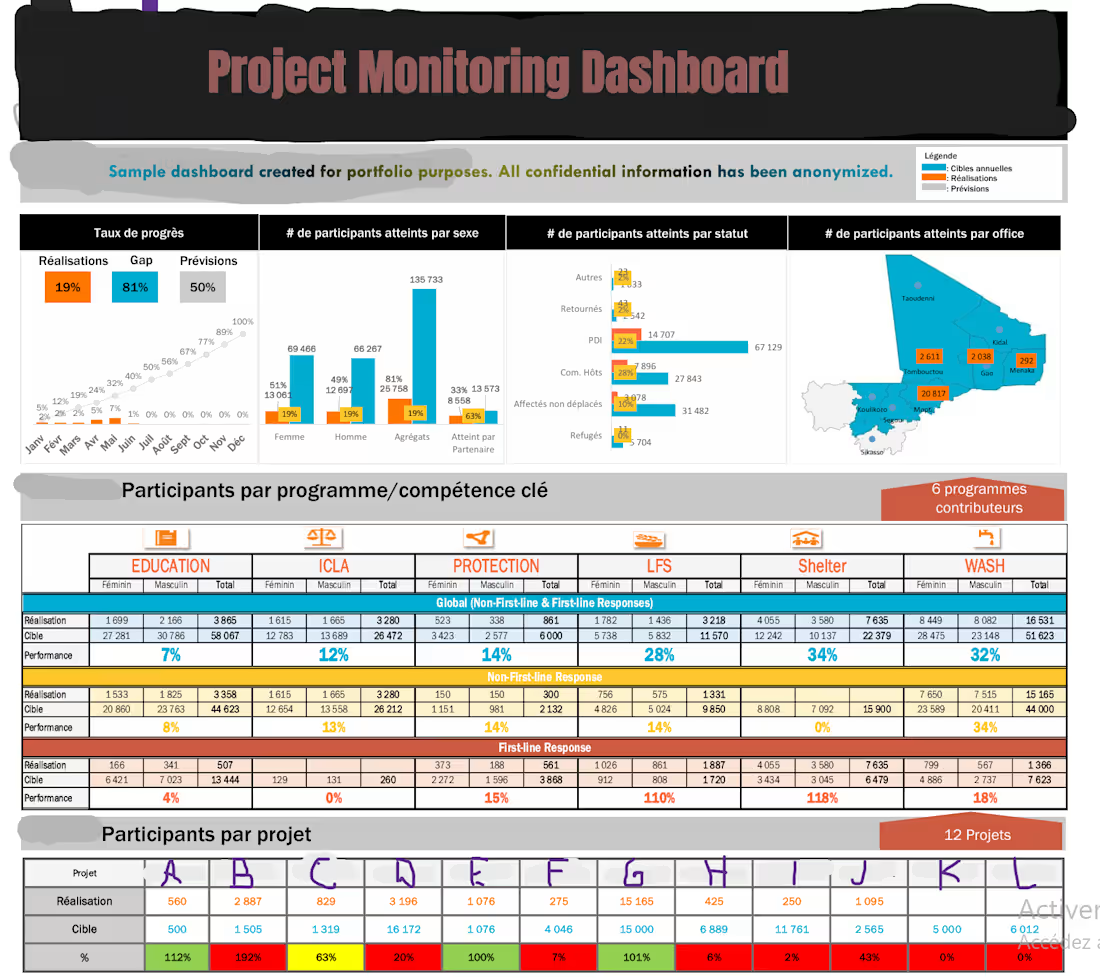
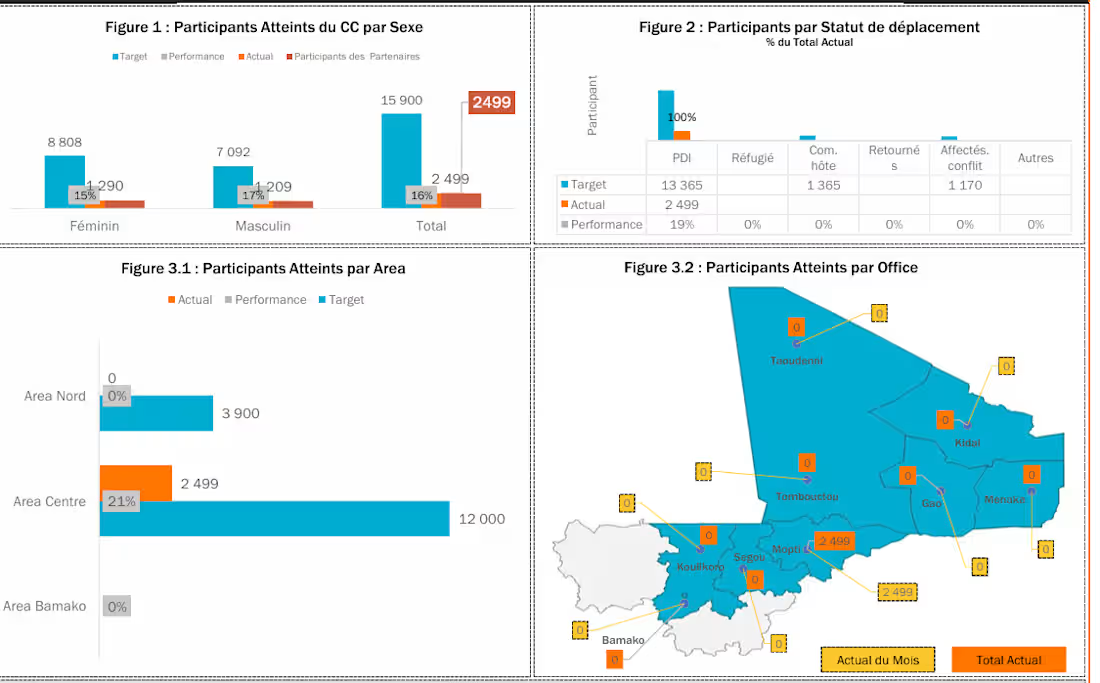
Project Monitoring Dashboard created in Microsoft Power BI for Monitoring, Evaluation, Accountability and Learning (MEAL). This interactive dashboard tracks project progress, beneficiary statistics, gender and displacement status, KPI performance, and geographic coverage. The dashboard includes data cleaning, data modeling, DAX measures, interactive filters, and dynamic visualizations. All confidential information has been anonymized for portfolio purposes.
1
65