Laiba Mushtaq
Excel & Data Analyst — Cleaning, Dashboards & Power BI
New to Contra
Laiba is building their profile!
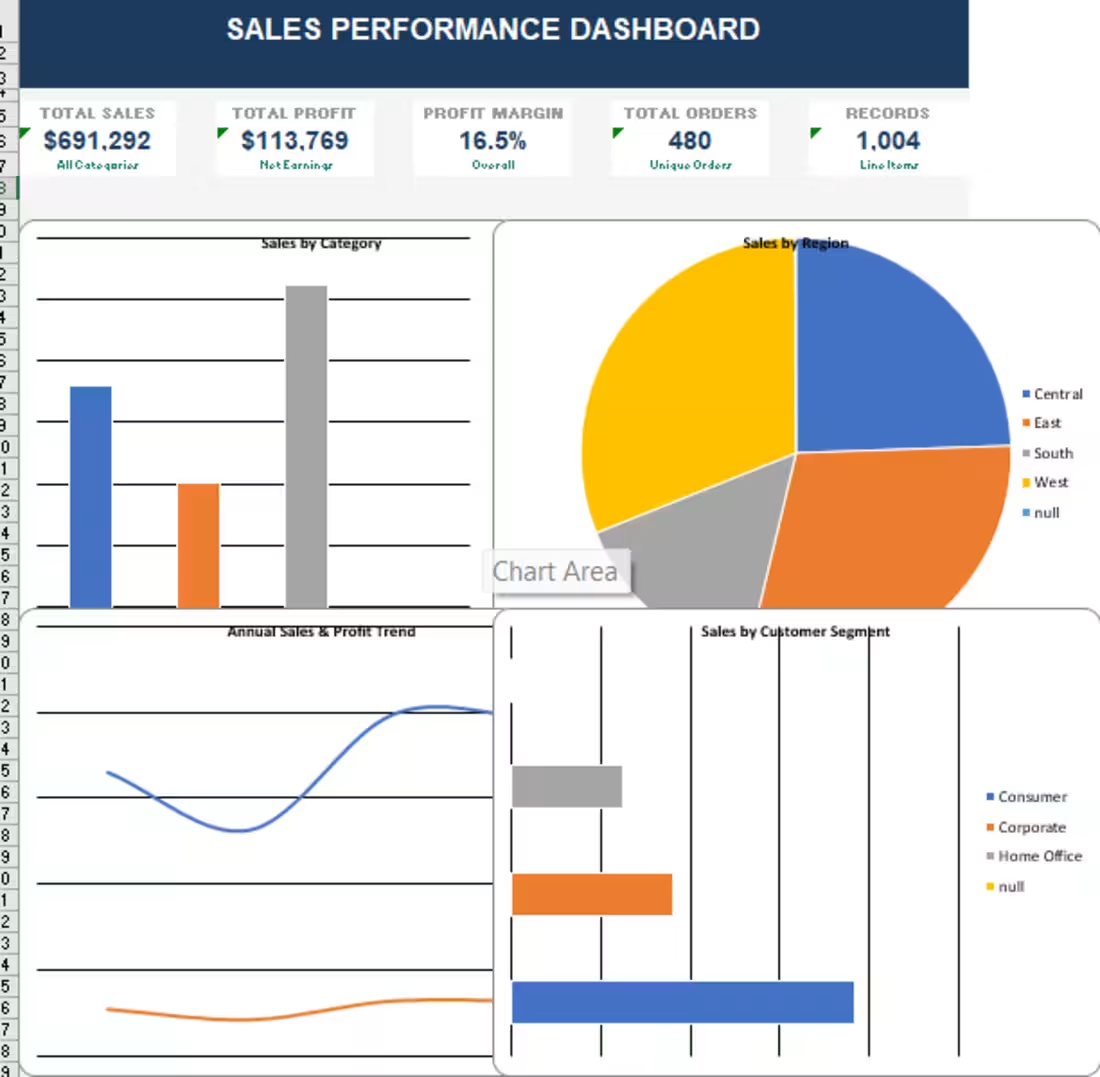
A complete sales dashboard built in Excel using 1,000+ real retail records. Includes KPI summary cards for total sales, profit, and margin, four charts covering category, region, annual trend and customer segment, and pivot tables for quick data summarization. Built for business owners and teams who need a clear view of their numbers without complexity.
0
32
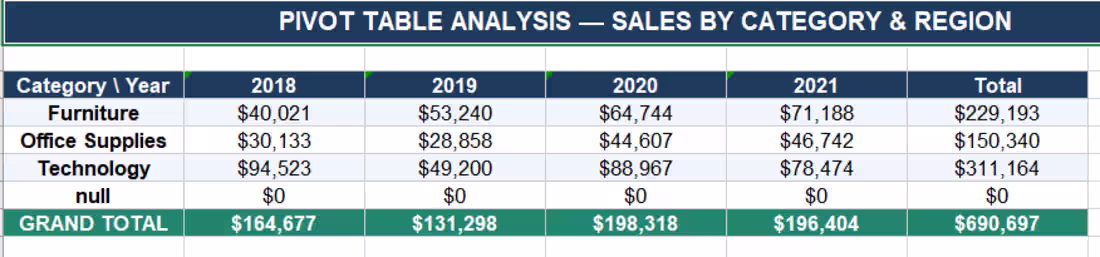
Pivot table analysis showing sales breakdown by category and year, with grand totals and regional cross-analysis. Built for quick business decision-making.
0
19
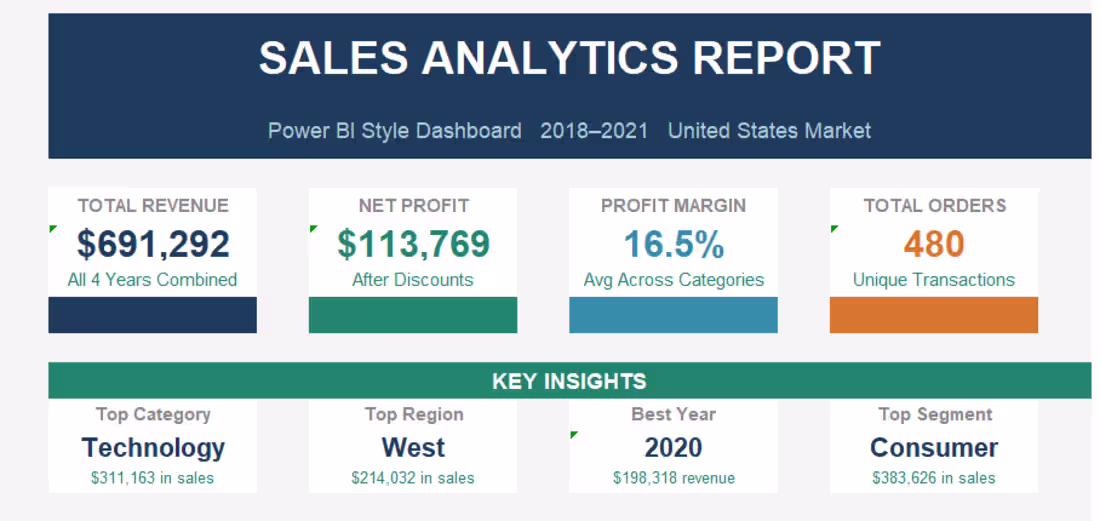
Power BI style analytics report covering category performance, year-over-year growth, regional market share, and executive KPI summary with profit margin tracking.
0
25
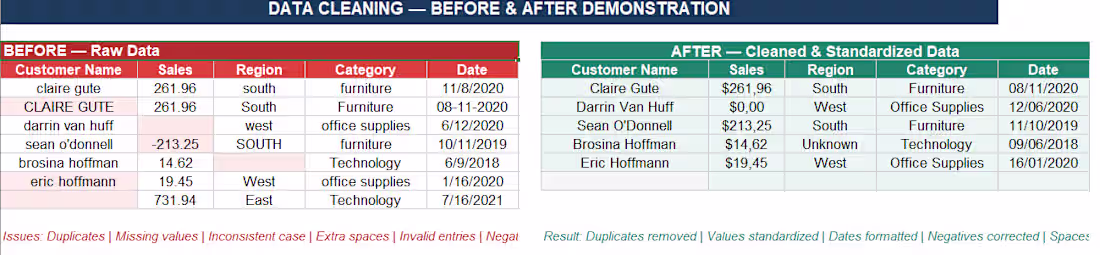
Before and After data cleaning — duplicates removed, inconsistent text standardized, missing values handled, dates reformatted. Raw data transformed into analysis-ready output.
0
28