
Kamalesh R
Aspiring Data Analyst | Excel, Python & Power BI



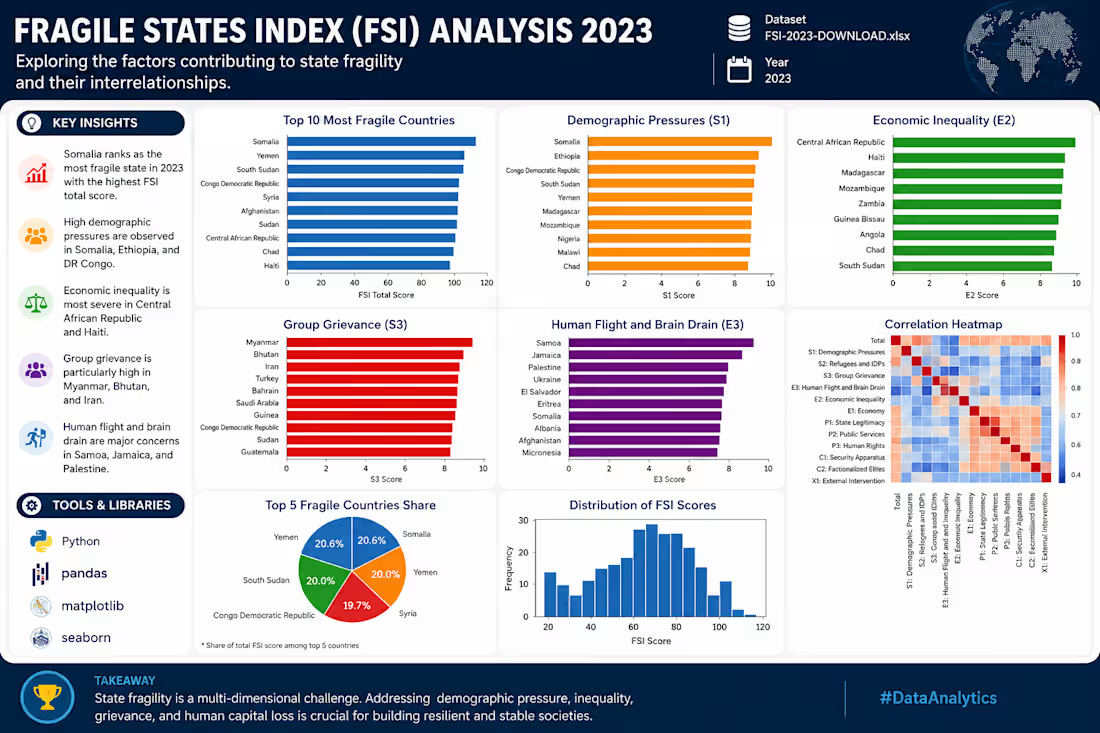
This project analyzes the Fragile States Index (FSI) 2023 dataset to identify factors contributing to state fragility across different countries.
Using Python, Pandas, Matplotlib, and Seaborn, I cleaned and analyzed the dataset and created a dashboard containing multiple visualizations. The analysis focused on key indicators such as:
Demographic Pressures
Economic Inequality
Group Grievance
Human Flight and Brain Drain
Overall FSI Score
I also created a correlation heatmap to understand relationships between different indicators and used statistical visualizations to identify trends and patterns among countries.
0
91
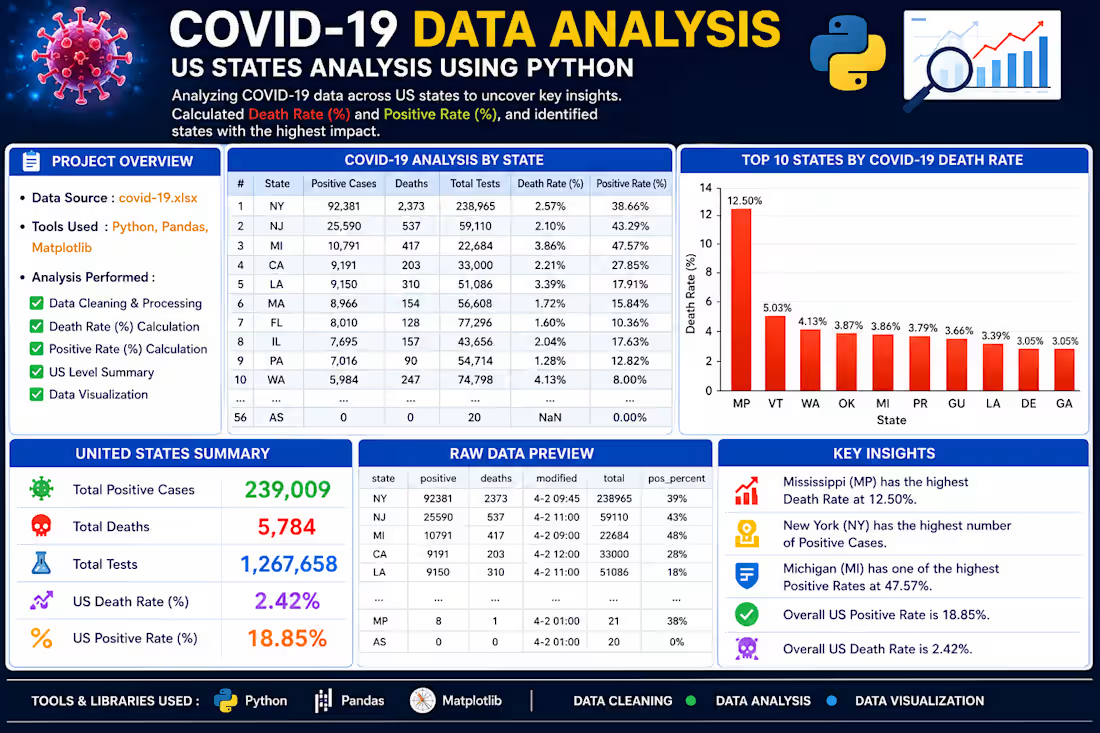
Analyzed COVID-19 data across US states using Python, Pandas, and Matplotlib. Cleaned and processed raw Excel data, calculated key metrics such as Death Rate (%) and Positive Rate (%), and generated US-wide summary statistics. Created visualizations to identify trends and compare state-level COVID-19 impacts. This project demonstrates skills in data cleaning, analysis, and data visualization.
0
125