
Kadiyala Sravani
Data & Business Analyst | SQL, Power BI, Tableau, Excel
New to Contra
Kadiyala is building their profile!

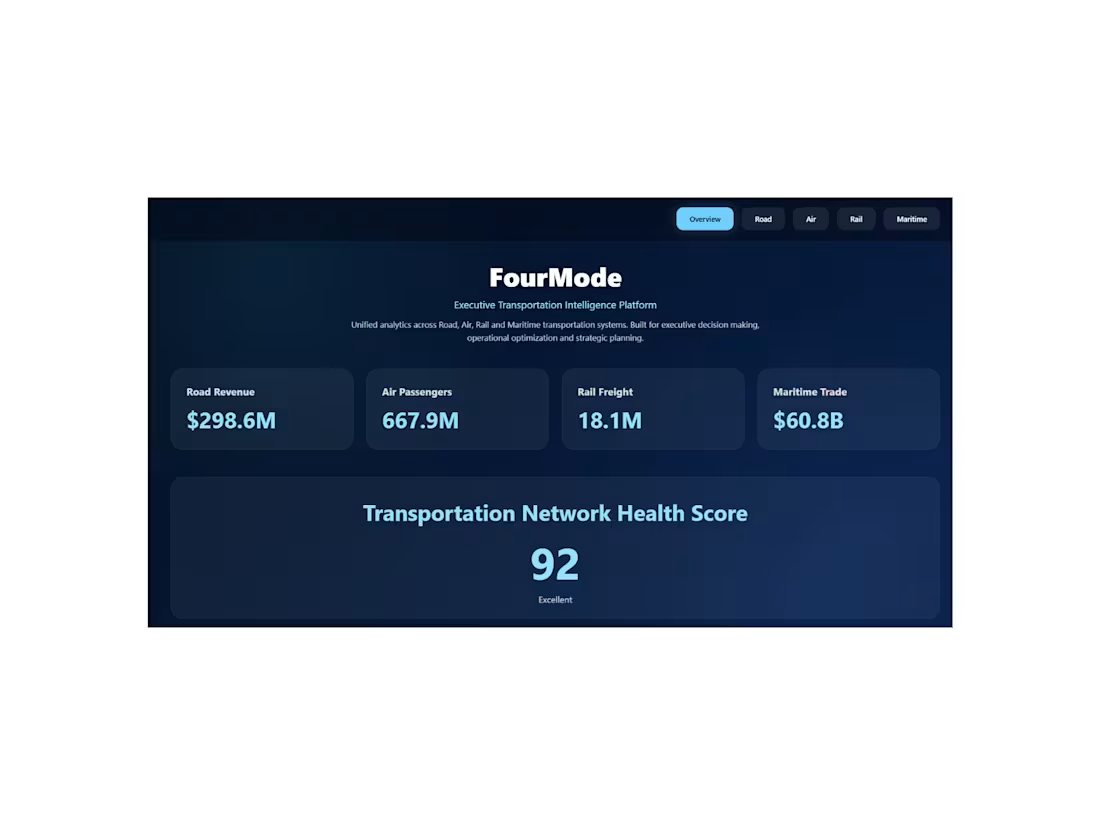
FourMode — Multi-Modal Transportation Intelligence Dashboard
An executive analytics platform that unifies Road, Air, Rail, and Maritime transportation data into a single decision-making view — built for operational optimization and strategic planning across an entire transport network.
Instead of leaders juggling separate reports for each transport mode, I consolidated the key metrics into one interactive dashboard with an Overview plus drill-down tabs for each mode, and a composite Network Health Score that summarizes overall system performance at a glance.
What it surfaces:
• Road revenue ($298.6M), air passengers (667.9M), rail freight (18.1M), and maritime trade ($60.8B) side by side
• A single Transportation Network Health Score (92/100) to track overall network performance
• Per-mode breakdowns so executives can spot which segment is underperforming and act on it
Designed for executive decision-making: one screen that turns four separate data streams into a clear, comparable performance picture.
1
8
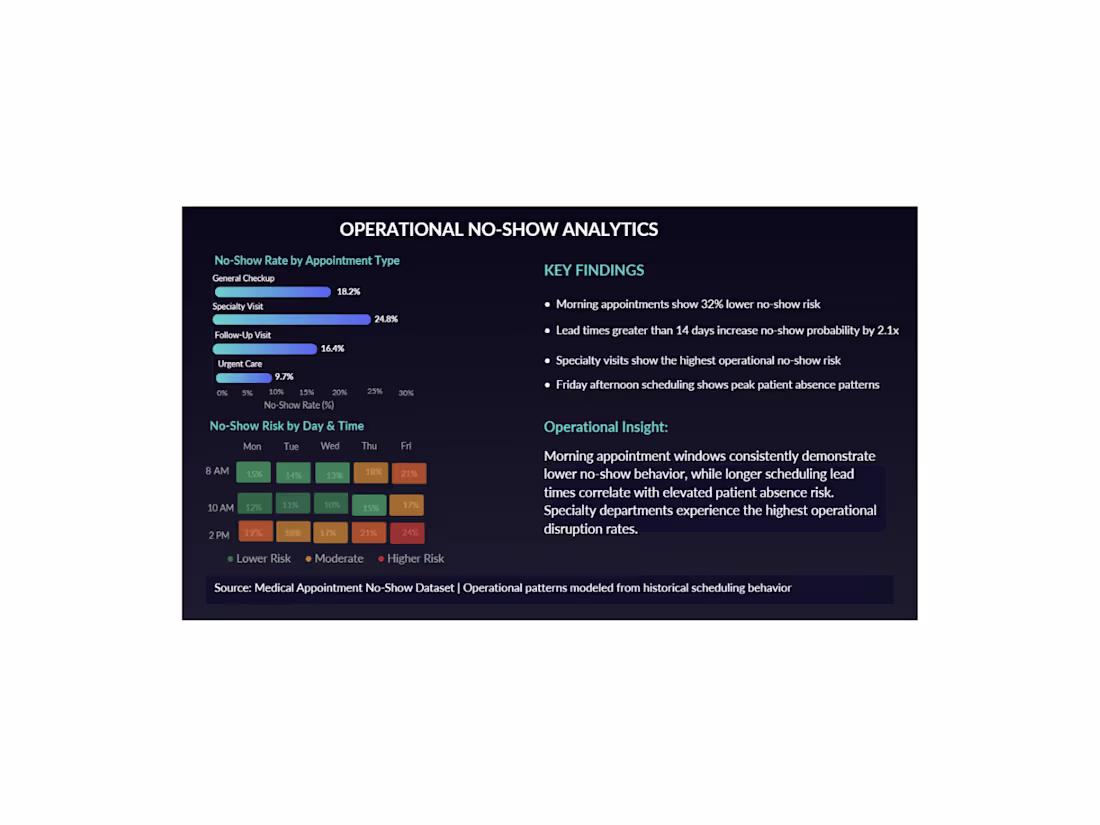
Patient No-Show Analytics — Risk Patterns by Appointment Type, Day & Time
An analysis of patient no-show patterns to help healthcare providers predict and reduce missed appointments — the operational problem behind the revenue recovery work.
Using a medical appointment no-show dataset, I identified which appointment types, days, and time slots carry the highest no-show risk, then visualized the patterns as a clear risk profile leadership and scheduling teams can act on.
Key findings:
• Specialty visits had the highest no-show rate (24.8%), versus just 9.7% for urgent care
• Morning appointments showed 32% lower no-show risk than afternoons
• Lead times over 14 days increased no-show probability by 2.1x
• Friday afternoons were the consistent peak for patient absences
The takeaway: schedule high-value specialty visits in low-risk morning windows, shorten booking lead times, and target reminders at the highest-risk slots. Built as a risk heatmap and breakdown that turns scheduling data into concrete operational decisions.
Source: public Medical Appointment No-Show dataset; patterns modeled from historical scheduling behavior.
1
20
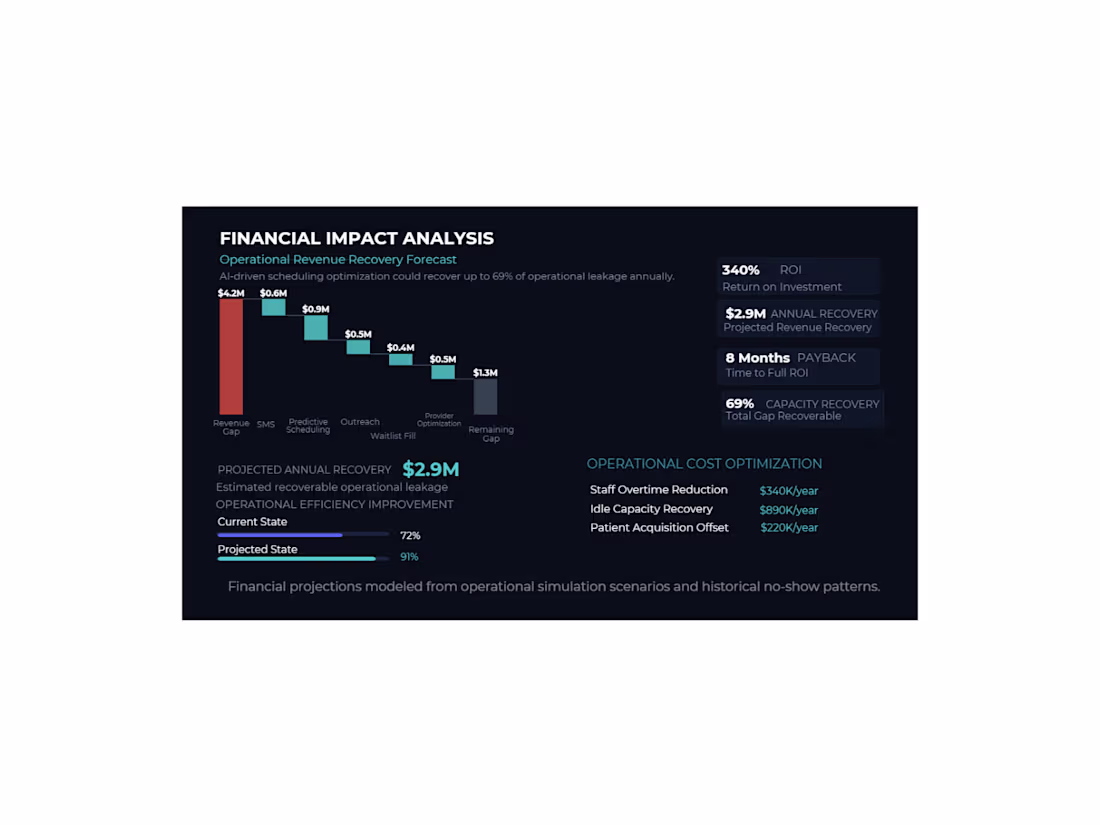
Healthcare Revenue Recovery Analysis — Scheduling Optimization Dashboard
A financial-impact analysis modeling how scheduling optimization could recover lost revenue for a healthcare provider losing income to no-shows and unfilled appointment slots.
I broke down a $4.2M annual revenue gap into specific recovery levers, SMS reminders, predictive scheduling, patient outreach, waitlist fill, and provider-schedule optimization and visualized each one's contribution in a waterfall chart to show exactly where the money could be recovered.
Key findings:
• ~$2.9M (69% of the gap) identified as recoverable
• 340% projected ROI with an 8-month payback period
• Operational efficiency modeled to rise from 72% to 91%
• Cost savings mapped across overtime reduction ($340K), idle-capacity recovery ($890K), and patient-acquisition offset ($220K)
Built as a clear, executive-ready dashboard that turns operational data into a single revenue story leadership can act on. Projections were modeled from operational simulation scenarios and historical no-show patterns.
1
43