
Jyoti Dewangan
Data Analyst | SQL ,Tableau ,Power BI | Dashboard & Insight
New to Contra
Jyoti is ready for their next project!
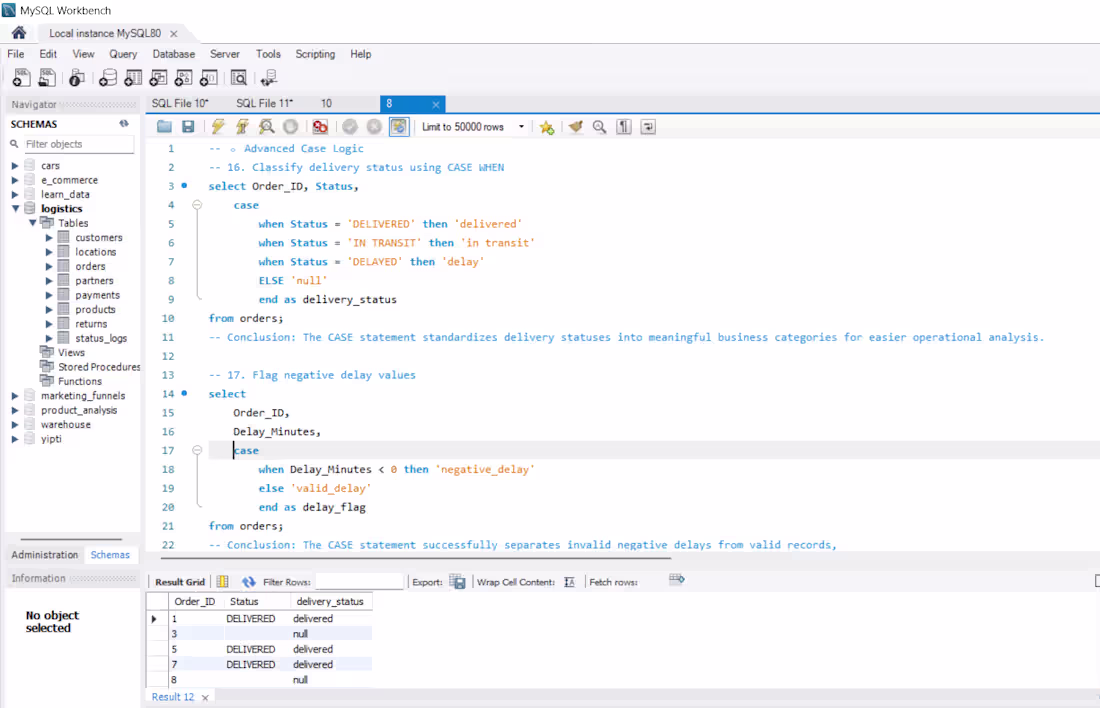
SQL Logistics Operations Analysis | MySQL Business Insights Project
Advanced SQL-based logistics analysis project developed using MySQL Workbench to identify delivery delays, return patterns, operational inefficiencies, and customer behavior insights.
The project involved solving real-world business problems using:
• Subqueries
• CASE WHEN logic
• CTEs (Common Table Expressions)
• Window Functions
• RANK(), DENSE_RANK()
• LAG() & LEAD()
Key insights generated:
✔ Cities with highest return rates
✔ Delivery partners performing below average
✔ Customer and product ranking analysis
✔ Payment failures despite successful deliveries
✔ Delivery delay trend analysis
Tools Used:
SQL | MySQL Workbench | Data Analysis | Business Intelligence
0
10

I’ve been focusing on building strong foundations in data analysis by working on real-world datasets and end-to-end projects.
My work typically involves:
Cleaning and transforming raw data (Python / Excel / Power Query)
Writing SQL queries to extract meaningful insights
Building dashboards in Tableau & Power BI
Identifying key metrics and business KPIs
💡 I’m especially interested in solving problems like:
Understanding sales and profit trends
Analyzing customer behavior
Finding root causes of losses or high returns
Measuring campaign and performance impact
Instead of just creating dashboards, my focus is on:
👉 turning data into clear, actionable insights
Currently working on multiple datasets to improve:
Data storytelling
Dashboard design
Business understanding
I’m open to feedback, collaboration, and entry-level opportunities in data analysis.
If you’re working on something similar or have suggestions, I’d love to connect 🤝
2
52
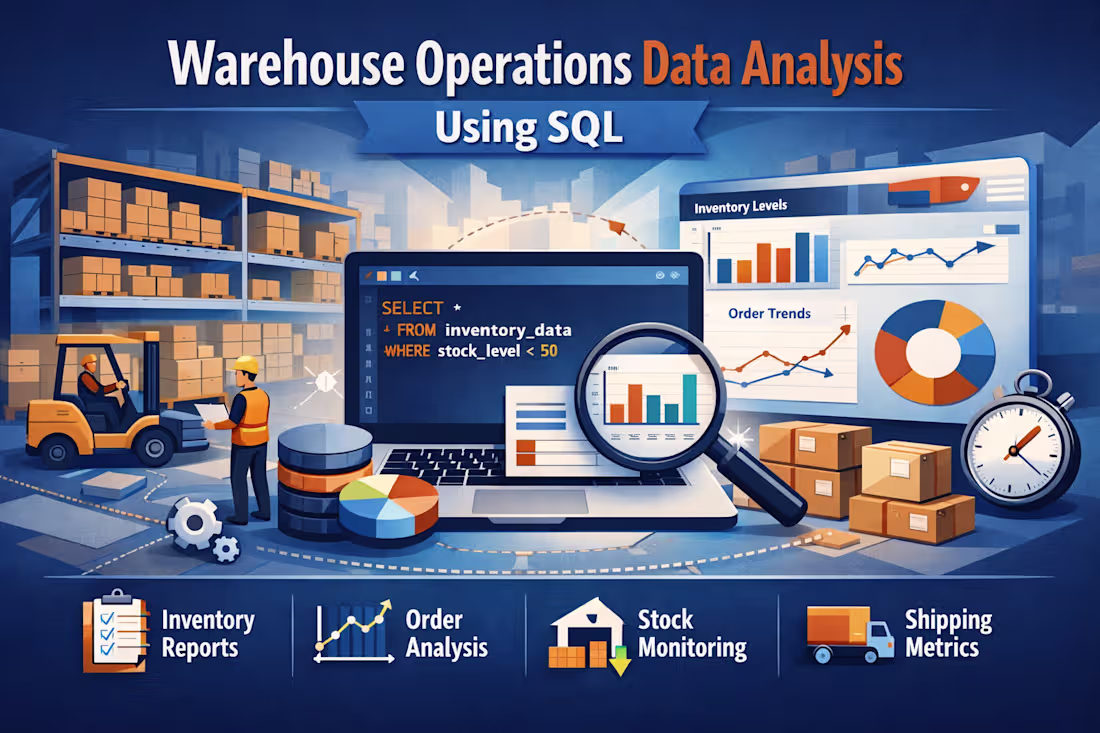
Warehouse Operations Data Analysis using SQL
This project focuses on analyzing warehouse operational data using SQL to derive business performance metrics.
The analysis includes revenue tracking, profit margin evaluation, stock balance monitoring, and delivery performance measurement.
Key Outcomes:
Identified revenue contribution by warehouse and category
Calculated product and category-level profitability
Evaluated inventory balance using inbound vs outbound movement
Measured delayed order percentage for operational performance tracking
Tools: MySQL, SQL Analytics
0
36
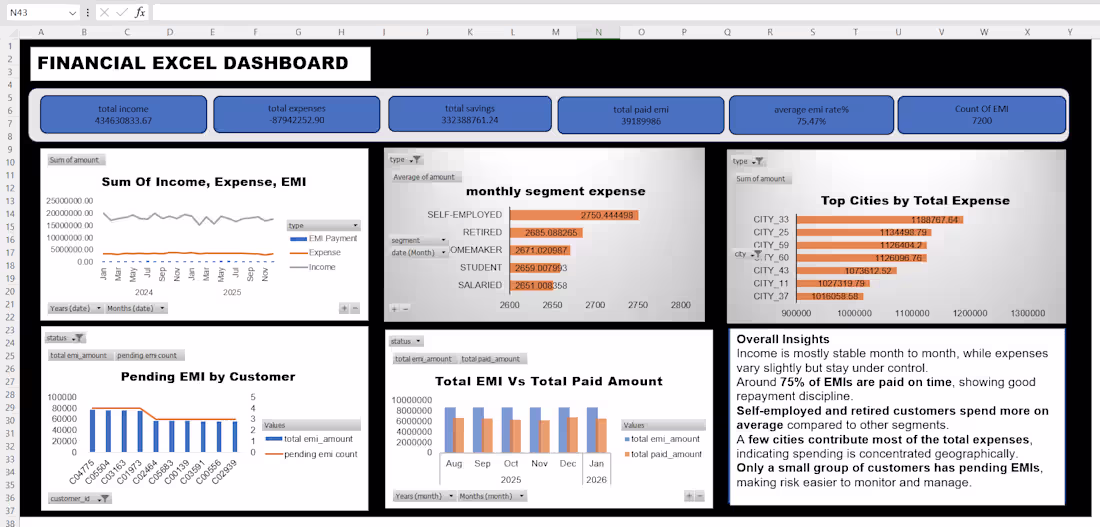
Built an Excel dashboard to analyze personal finance data including income, expenses, savings, and EMI trends.
The dashboard provides a high-level financial overview along with month-on-month and category-level insights using pivot tables and charts.
6
5
177

Built an Excel dashboard to analyze personal finance data including income, expenses, savings, and EMI trends.
The dashboard provides a high-level financial overview along with month-on-month and category-level insights using pivot tables and charts.
0
56
Developed a Power BI report to analyze average monthly expenses across customer segments. The analysis highlights month-wise spending trends and supports data-driven financial insights.
0
69
Developed a Power BI report to analyze average monthly expenses across customer segments. The analysis highlights month-wise spending trends and supports data-driven financial insights.
0
55
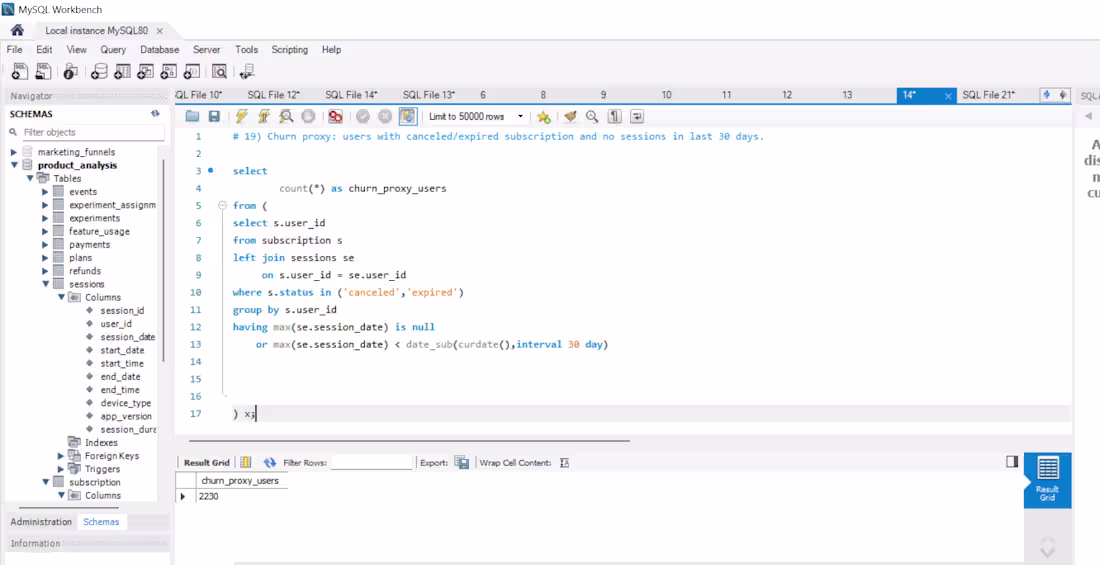
SQL Product Analytics (MySQL)
0
64
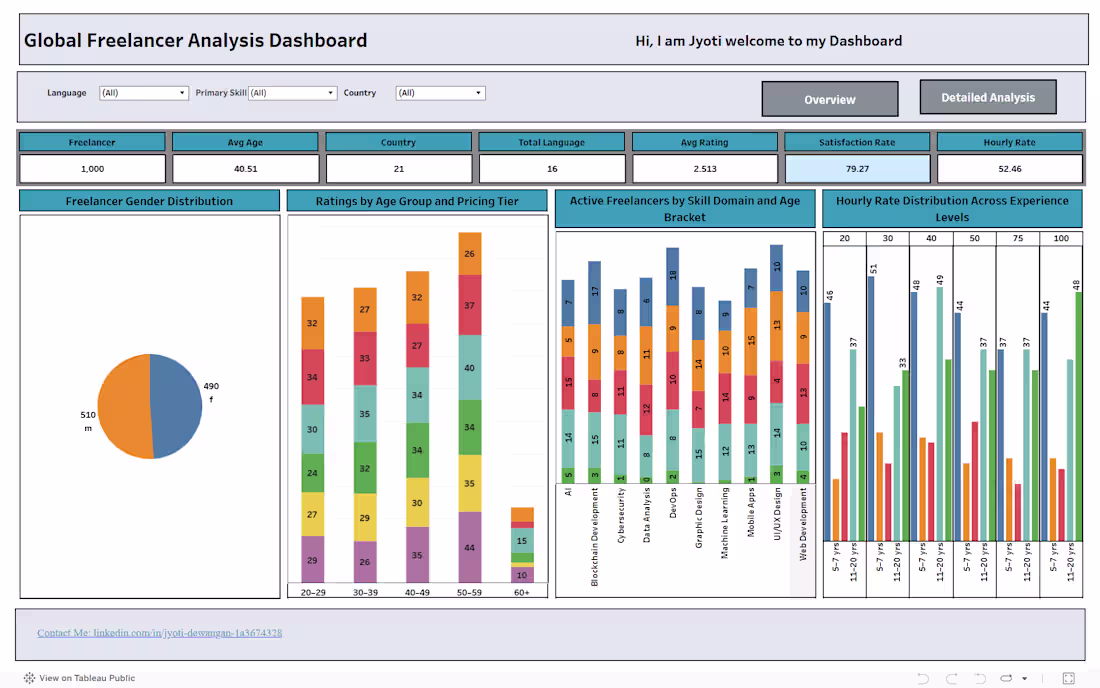
Global Freelancer Analysis Dashboard (Detailed)
0
57
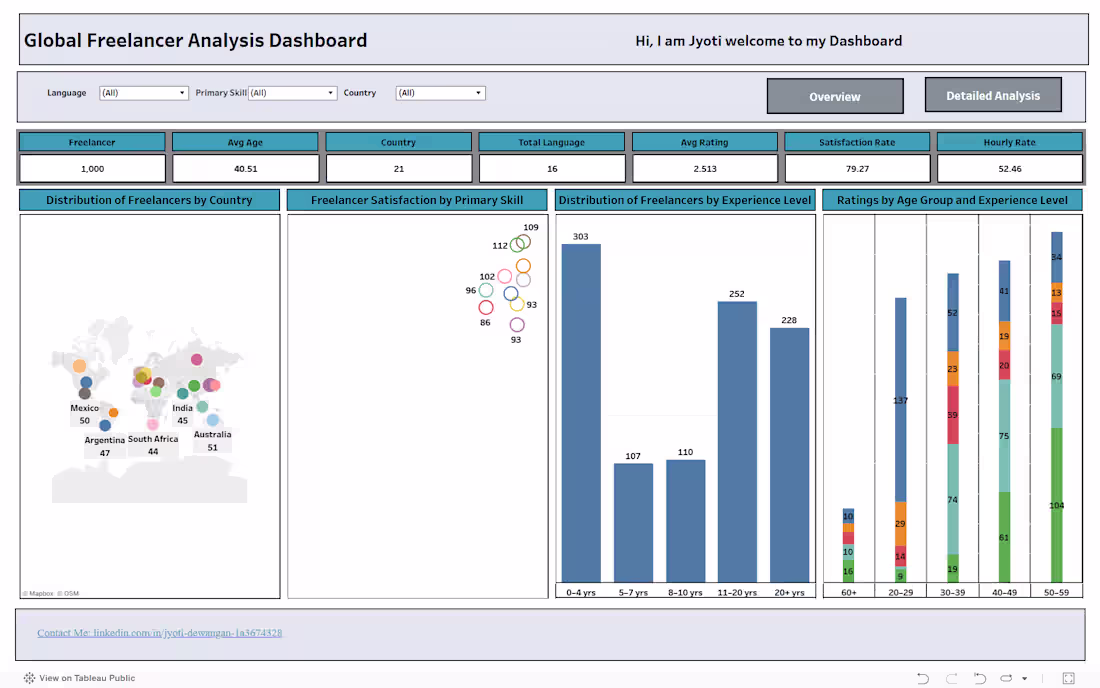
Global Freelancer Analysis Dashboard (Tableau)
0
50