
Joy Z
I turn messy spreadsheets into insight-driven tools.
Ready for work
Joy is ready for their next project!

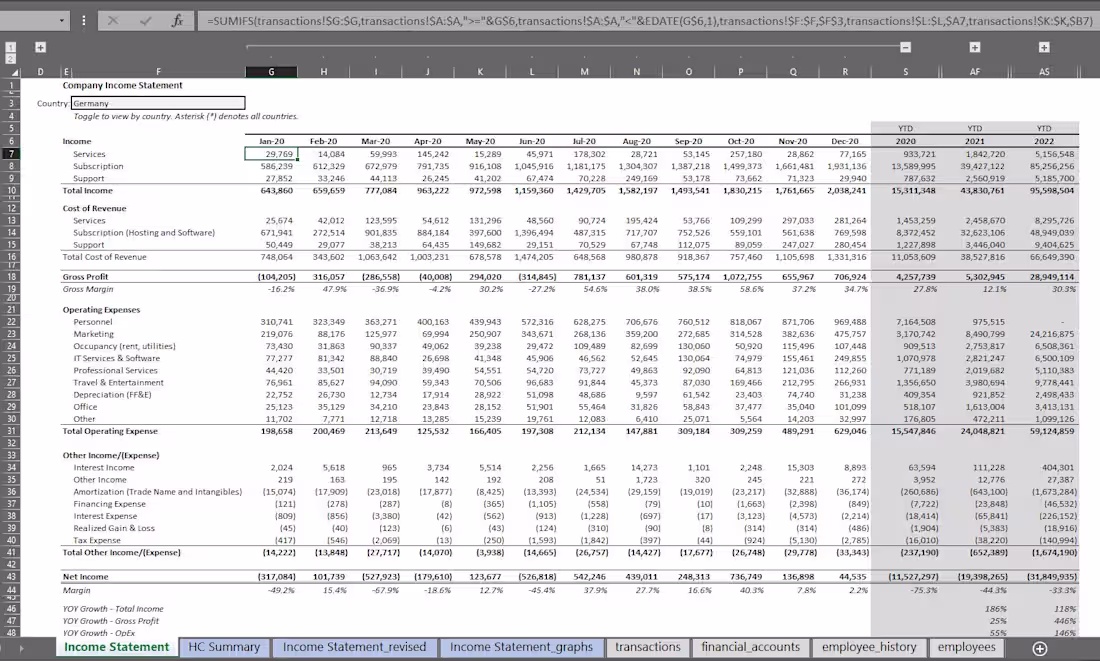
This was a small project for a SaaS startup to review the raw data, and generate a financial report. There were some known data anomalies and the goal of the project was to discover the extent of those data issues and how it impacted the reported financials.
In my deliverables, I provided a report of the income statement and headcount summary, with formulas built in to allow the user to toggle between different countries, or display the holistic income statement of all countries.
I also provided a quick report of what was observed in the current financials, the data anomalies, and what to realistically expect in the financials if we adjusted for those anomalies.
1
2
41
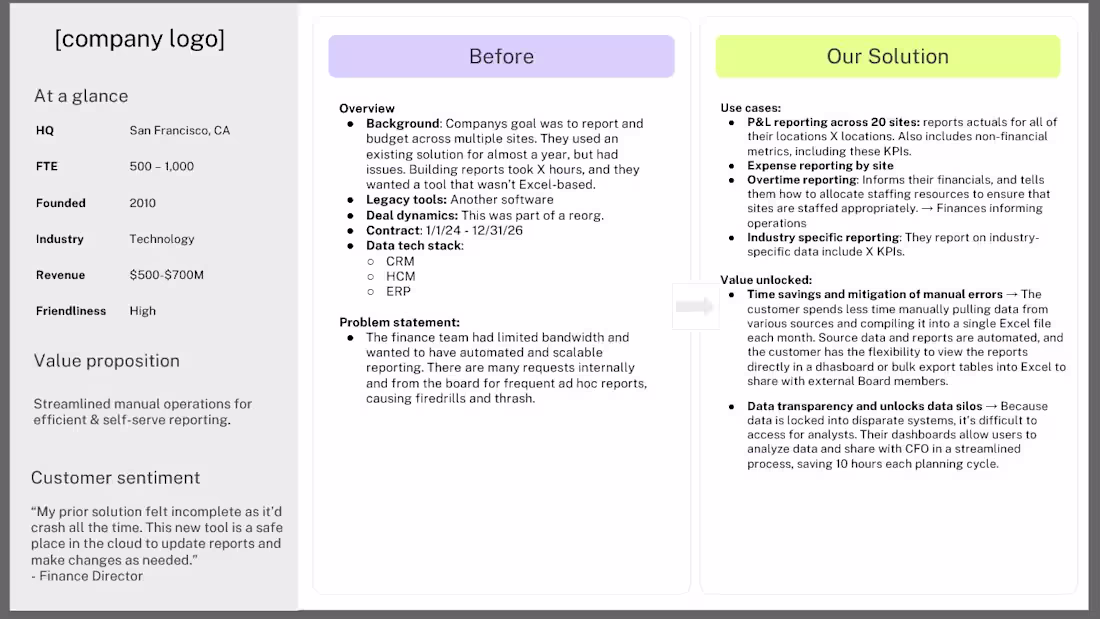
GTM enablement on customer value props slide deck
At this startup, the goal was to educate the sales and marketing team on how customers were getting value out of the platform. I created 30+ slides (one for each customer) on their "before" and "after" states, collaborating with the CS team and directly with customers to get this data. I set up the Google Sheets deck in a templatized way to streamline the process when adding new customers to the deck.
Data and info has been obfuscated in attached pictures to maintain confidentiality.
10
128
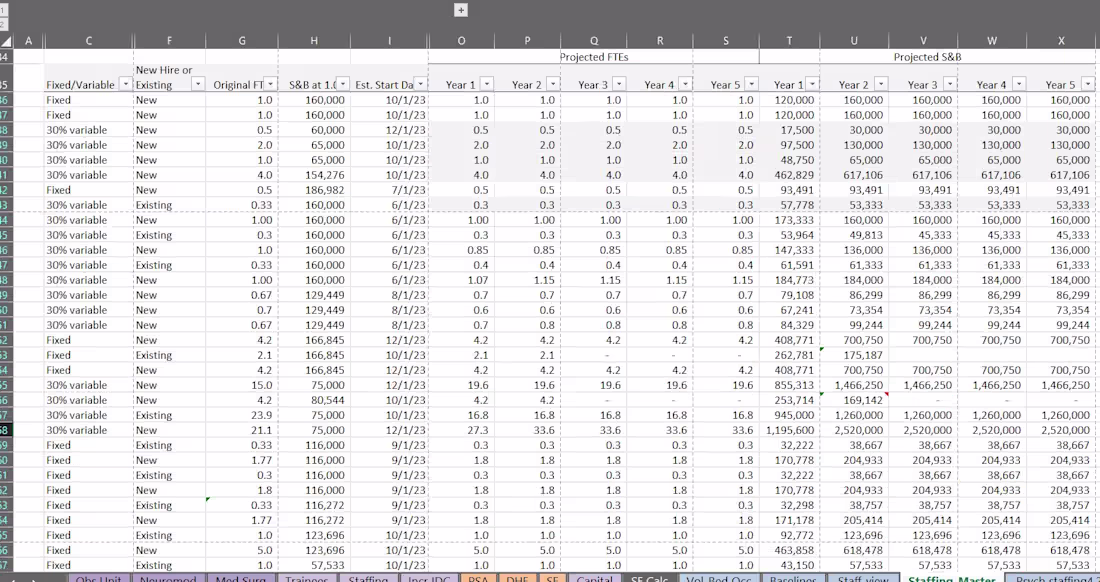
Excel model: 5-year forecast for new facility
I created a pro forma to forecast the financial impact of building a new healthcare facility. In the model, I built in dynamic levers to account for changes in operations, such as staff, number of available rooms in the building, and changes to state policy affecting revenue drivers. Model was built to be driver-based such that key drivers lived in their own tabs, and fed to primary summary pages for exec review.
Figures have been randomized in attached pictures with names removed to maintain confidentiality.
22
191
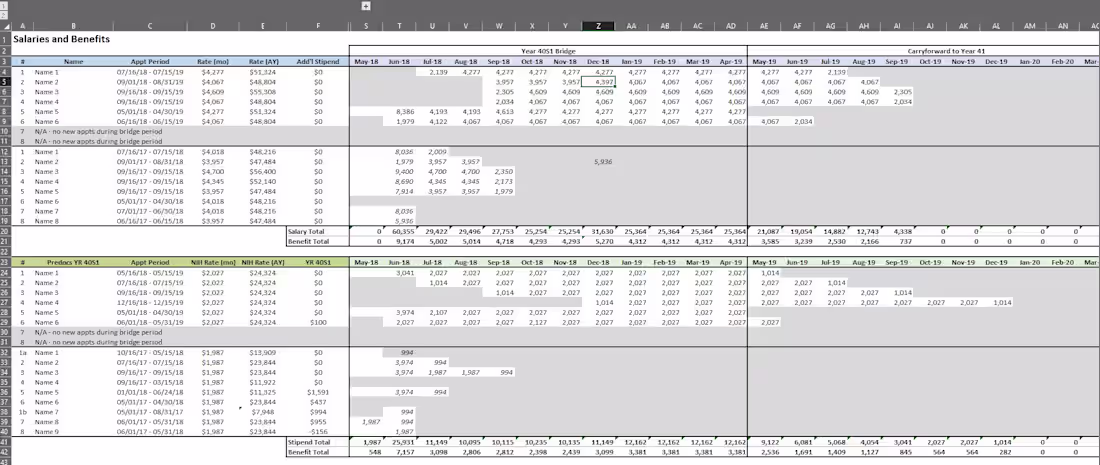
Salary and Benefits budget for grant tracking
The goal was to build a spreadsheet that tracked all expenses on a grant budget, the salary and benefits being the most complex. The challenge was capturing all employees' varying start/end dates at varying amounts, and designed in a digestible way for non-finance users to understand. The spreadsheet needed to also account for one-off stipend amounts that didn't align to regular budget cycles.
Figures have been randomized in attached pictures with names removed to maintain confidentiality.
0
37