
Johan Van Der Linde
Turning data into actionable business insights and growth
New to Contra
Johan is building their profile!

Unprocessed Meter Billing Tracker | R2.06M Revenue At Risk DashboardDescription:
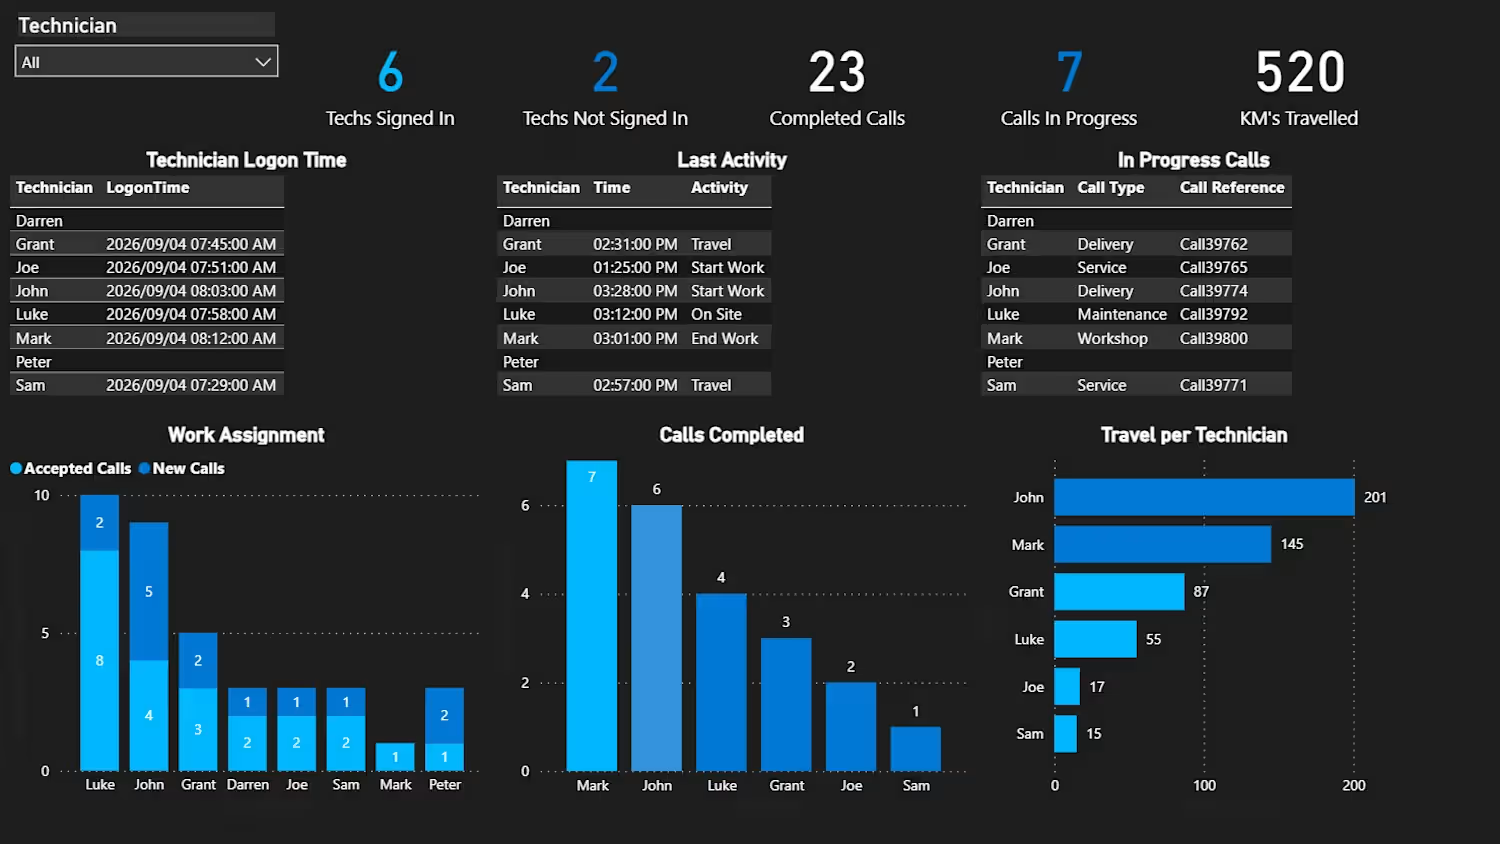
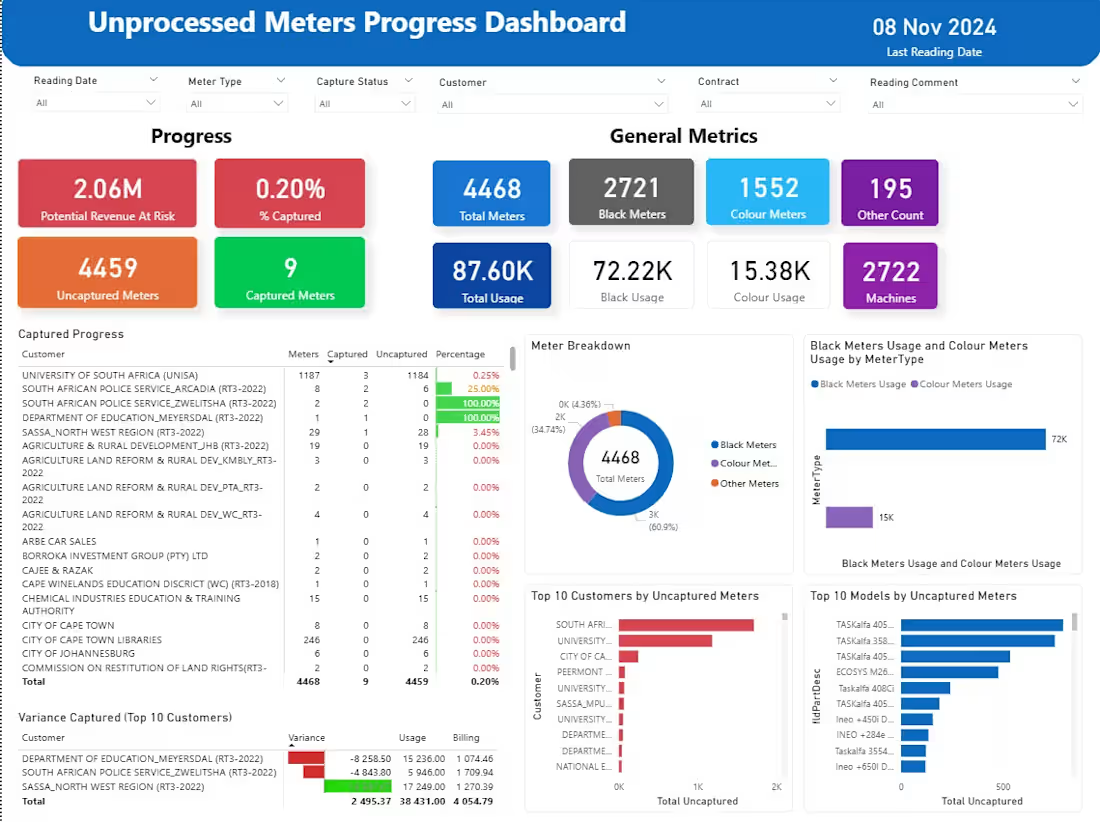
Built for national managed print services / office automation — tracking meter billing capture across 4,468 machines and R2M+ in potential billing.
The Problem: Client couldn't see which customer meters weren't captured, couldn't bill. 4,459 uncaptured meters = R2.06M revenue at risk. No priority, no ownership. Finance was blind.
What I Built:Real-time Unprocessed Meters Progress Dashboard — the control room for contract billing.
Executive Header:2.06M Potential Revenue At Risk (the money shot)0.20% % Captured vs 4459 Uncaptured — urgency visible in red/orange/green
General Metrics: 4468 Total Meters | 2721 Black | 1552 Colour | 195 Other | 2722 Machines
Total Usage: 87.6K (Black 72.22K / Colour 15.38K)Deep Dive Modules I Built:Captured Progress by Customer — per customer: Meters, Captured, Uncaptured, %. Instant accountability. UNISA 1187 meters, 0.25% captured — immediate action.
Meter Breakdown Donut — 60.9% Black, 34.7% Colour — composition at a glance
Usage by MeterType — Black vs Colour usage — 72K vs 15K — shows billing impact
Top 10 Customers by Uncaptured Meters — where to focus collectors first
Top 10 Models by Uncaptured Meters — TASKalfa 4054, 358ci etc — identifies device/process issues
Variance Captured — Billing vs Usage variance detection — prevents under/over billing (R2,495 variance tracked)
Tech & Logic:Advanced SQL to join contracts, meters, readings, billing tablesComplex business rules: Reading Date filtering, Capture Status logic, Variance calc (Usage vs Billing)
6x slicers: Reading Date, Meter Type, Capture Status, Customer, Contract, Reading Comment
Handles large relational dataset: 4468 meters x readings history
Result: Billing team went from "we think we missed some" to "we have R2.06M at risk, here are top 10 customers, go collect". Moved capture rate tracking from weekly Excel to live.
Direct impact on cash flow.
0
16
Multi-Warehouse Stock Management Command Center
Built for a national office automation group operating across Cape Town, Durban & Johannesburg warehouses.
The Problem: No single view of stock.
Team was managing stock levels across 3 warehouses in Excel. No visibility on what’s on hand vs. on order vs. issued. Overstocking in one warehouse, stockouts in another. No value tracking.
What I Built:Live Power BI Command Center connected directly to SQL Server ERP data. (http://data.Top)
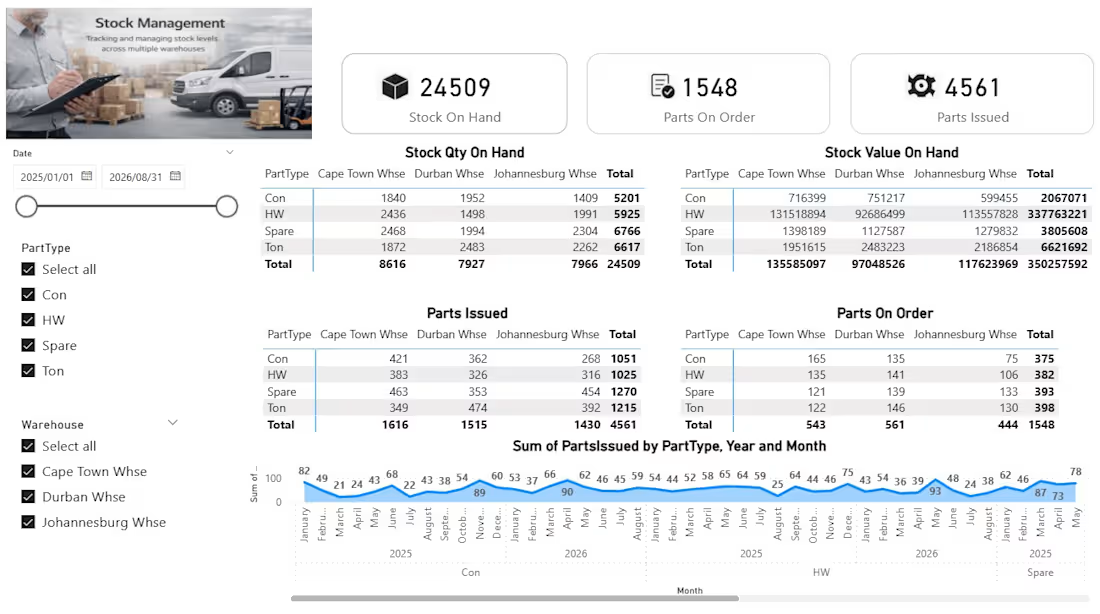
Top (http://data.Top) KPIs:24 509 Stock On Hand , 1 548 Parts On Order, 4 561 Parts Issued, 4 Core Modules:
Stock Qty On Hand — breakdown by PartType (Con, HW, Spare, Ton) x WarehouseStock Value On Hand — R35M+ total value tracked live (R13.5M CPT, R9.7M DBN, R11.7M JHB)
Parts Issued — consumption tracking by warehouse to spot trends/anomalies
Parts On Order — pipeline visibility to prevent stockouts
Trend Analysis — Sum of Parts Issued by PartType, Year & Month — 18 months trending
Features:Dynamic date range & slicers (PartType, Warehouse)SQL views with business logic — deduplication, status mapping. Handles large datasets (20K+ SKUs, 3 warehouses, multi-year history)Built for business users + ops team — investigative, not just reporting
Tech Stack: Advanced SQL (CTEs, Joins, Window Functions), SQL Server, Power BI, ERP Integration
Result: Ops team now sees in 10 seconds what took 2 hours in Excel. Prevented stockouts, reduced duplicate orders, gave finance live R35M stock value.
0
16
Field Service Live Command Center — Power BI
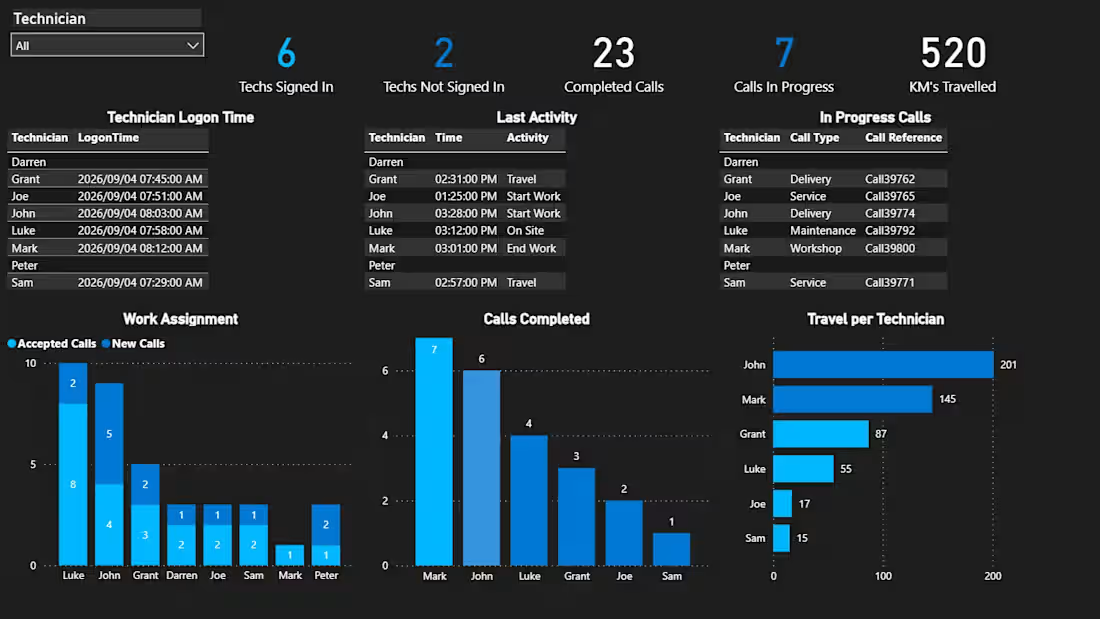
Live ops dashboard I built for MSP / print service clients to replace WhatsApp "where are you?" checks.Managers see in one glance at 3pm:6 techs signed in, 2 not signed in — staffing gap visible23 calls completed, 7 still in progress, 520 KMs travelled today — cost + productivityLogon Time table — who logged at 07:29 vs who never loggedLast Activity — Travel / Start Work / On Site / End Work with timestampIn Progress Calls — Call Type + Reference live (Delivery Call39762, Service Call39765)Work Assignment — Accepted vs New Calls stacked bar — shows overload (Luke: 8 accepted) vs idleCalls Completed — ranking per techTravel per Tech — John 201 KM vs Sam 15 KM — instant route / fuel insightBuilt in Power BI dark-mode for ops room TV, fed by SQL job data. DAX for KPIs, RLS so techs see only theirs.Outcome: dispatcher saved 1.5 hrs/day, stopped over-assigning same tech, KM cost down.Includes: .pbix file + data model + SOP for "Not Signed In" action.Screenshot uses anonymized demo data.
0
17
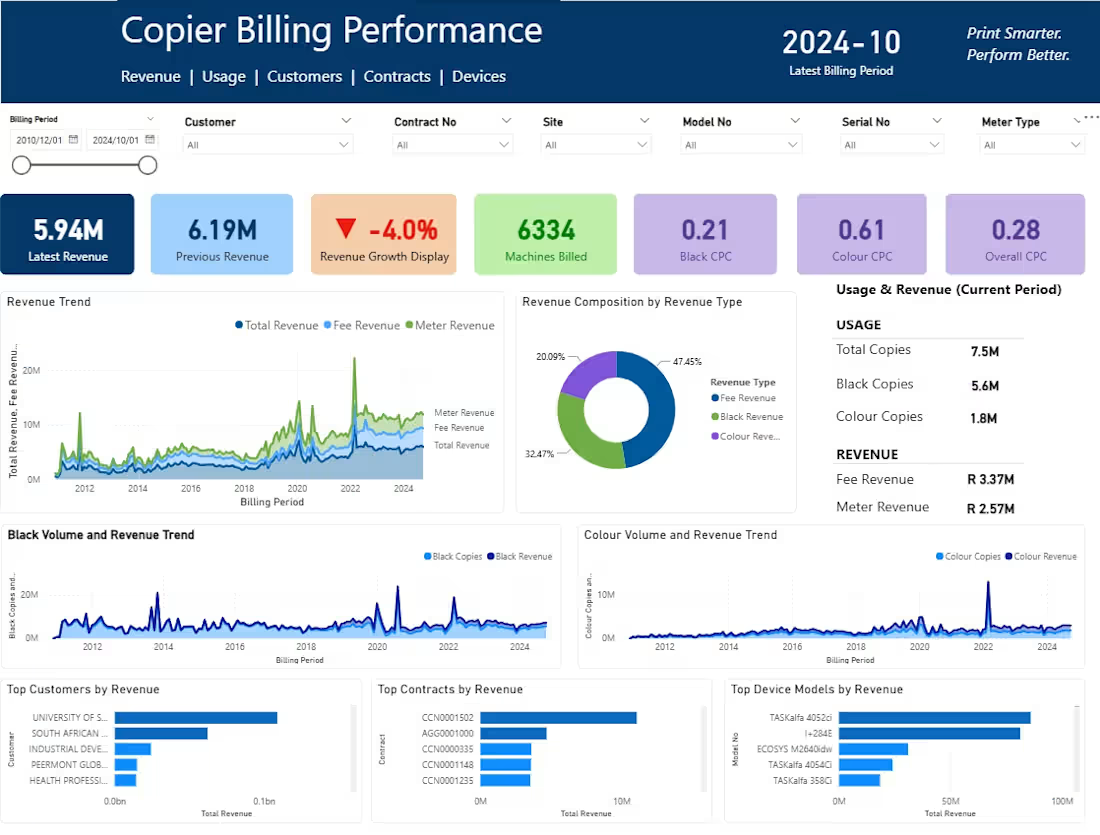
Power BI dashboard providing visibility into billing performance, revenue trends, customer activity, and operational KPIs. Built using SQL and ERP data to support proactive business decisions.
0
30