
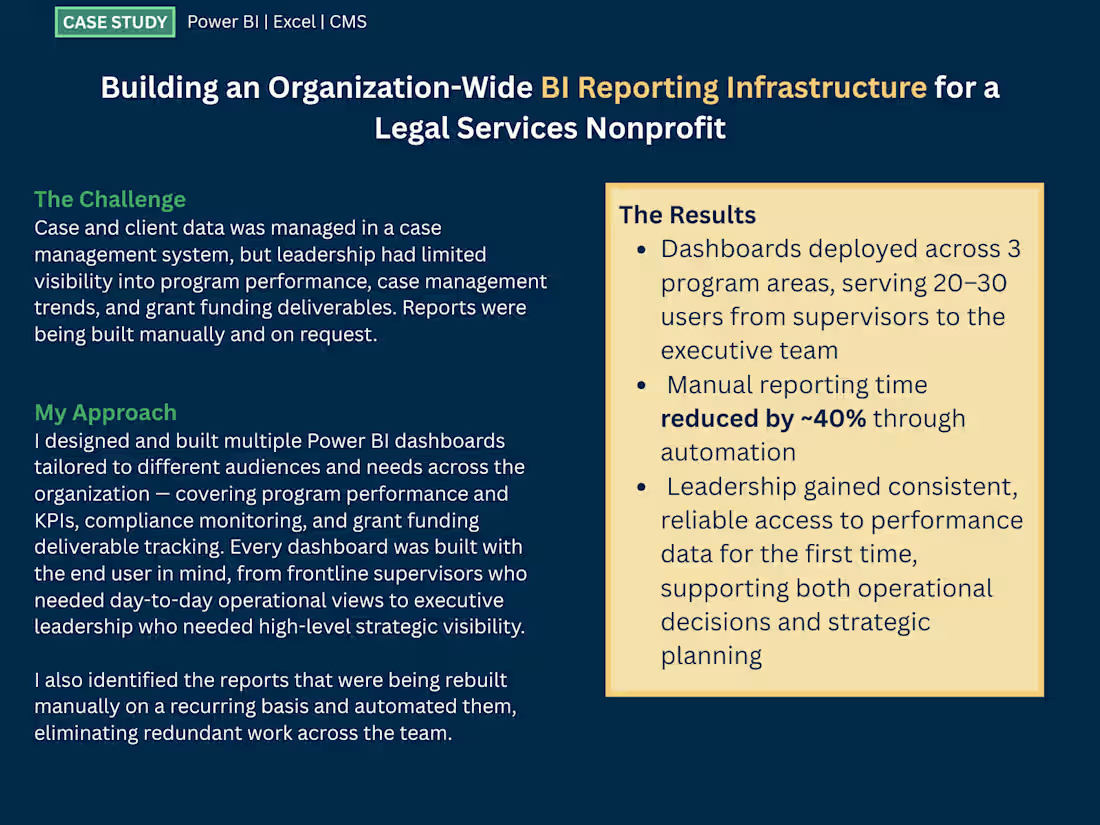
Building and Organization-Wide Reporting Infrastructure for Legal Services Nonprofit
A nonprofit legal services organization managed all case and client data across multiple program areas through a case management system (CMS). Reports on program performance, case trends and grant/funder compliance were being produced manually, upon request.
Developing a suite of Power BI dashboards, connected to the CMS through an API, around the distinct data needs of each of the programs focus areas allowed leadership access to consistent, real-time and reliable performance data for the first time — supporting operational and long-term strategic planning decision making, while reducing manual reporting time by approximately 40% through automation of recurring reports.
1
80
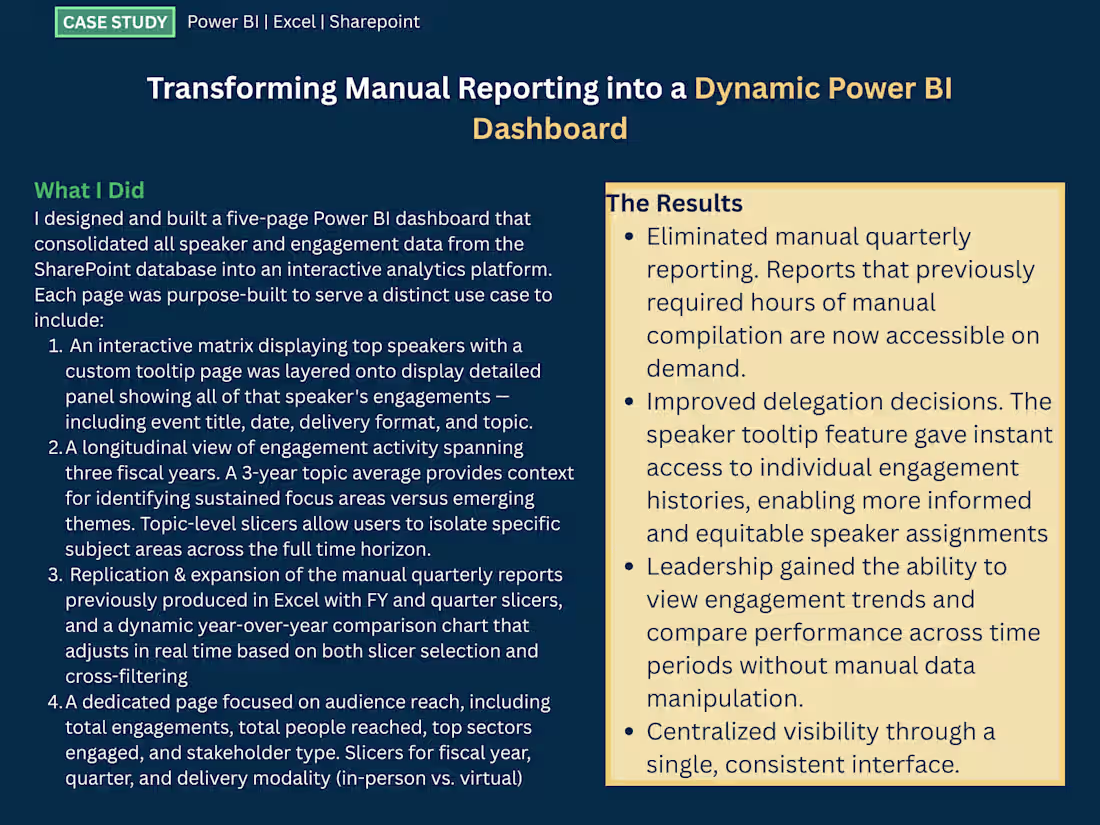
Transforming Manual Reporting into a Dynamic Power BI Dashboard
0
91
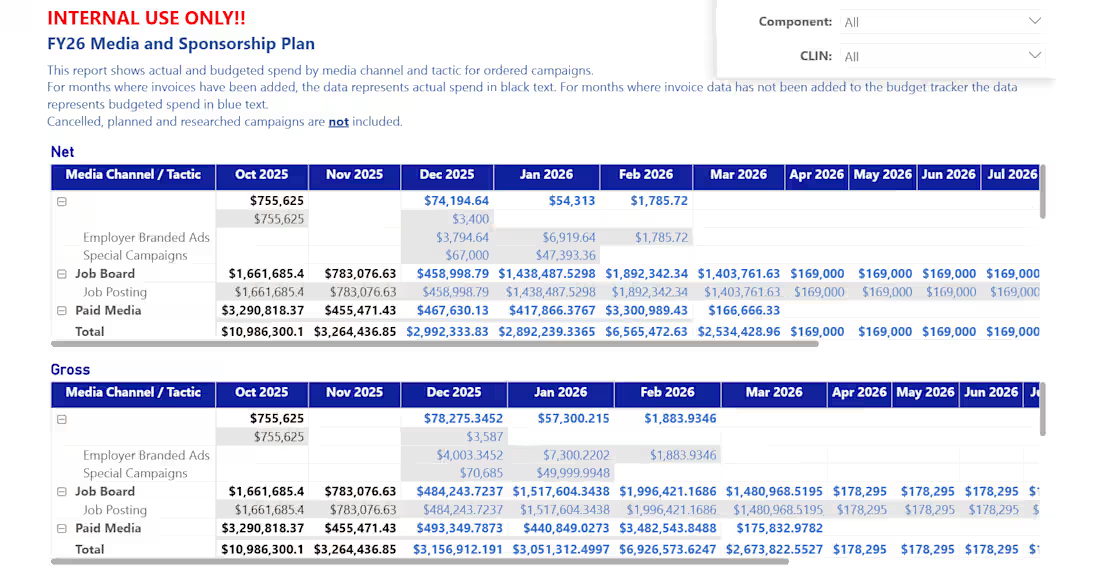
Campaign Budget
This dashboard took budget and invoiced data into one dashboard to track budgeted vs actual spend on a multi-million dollar media budget
1
1
58
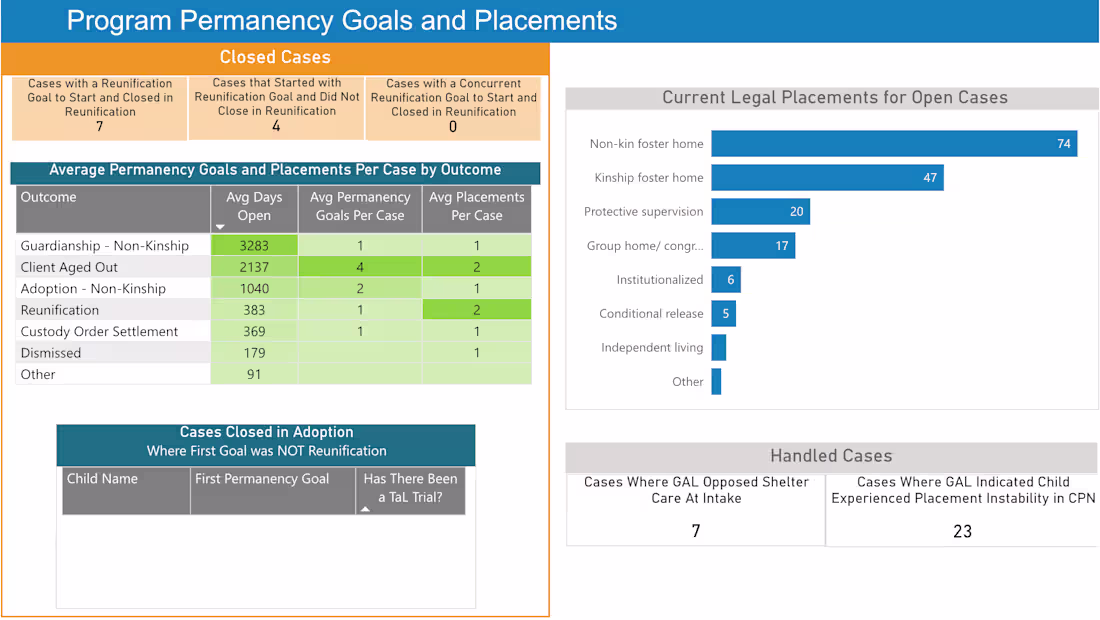
Non-profit Program Leadership Dashboards
These dashboards were built for a non-profit legal services organization to give program directors and organizational leadership on-demand visibility into the metrics that matter most to each of their programs. Rather than building a one-size-fits-all reporting tool, each dashboard was designed around the specific KPIs, contractual obligations, and operational questions unique to that program.
Across all three, the through-line is intentional design: each dashboard speaks the language of its program, surfacing the data points that directors actually reach for — not just the numbers that are easy to count.
1
60
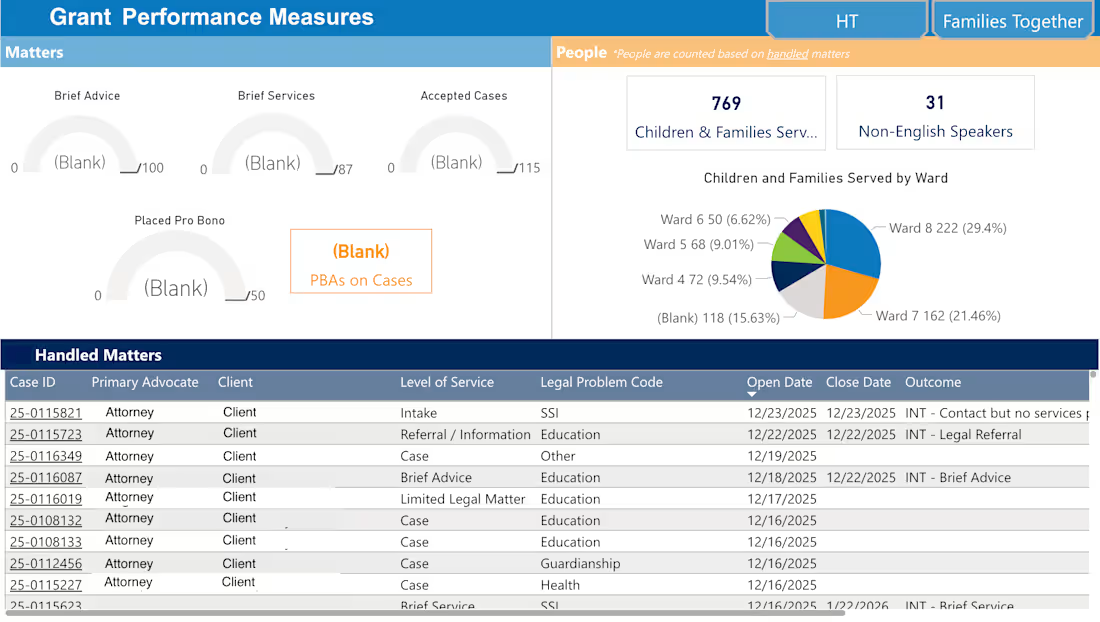
Grant Funding Performance Measures and Time Tracking
Grant-funded legal aid programs live and die by their data — funders require precise documentation of hours worked, clients served, and outcomes achieved. These dashboards replaced manual spreadsheet reporting with interactive, always-current views that program managers and leadership can navigate to track progress in seconds. Each page was built in Power BI and tailored to the specific reporting requirements of its grant funder.
0
59
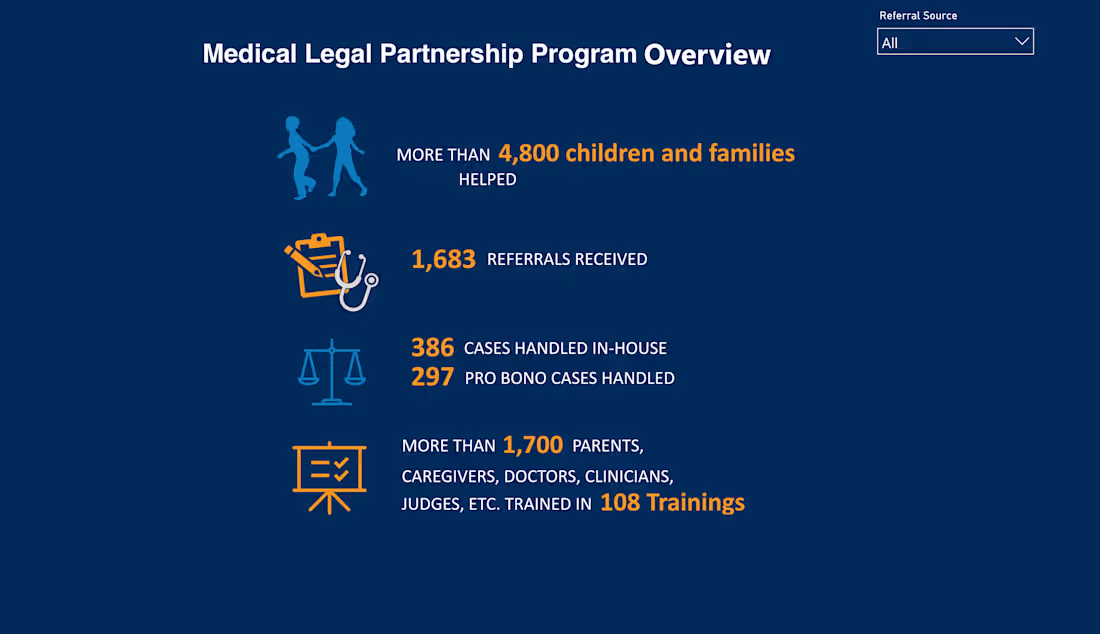
Medical Legal Partnership Metrics Reporting Dashboard
This Power BI dashboard was built for a legal services non-profit was built to replace the process of pulling together metrics for a regularly produced Power Point presentation on program performance. Historically, the slide deck required manual report running from multiple sources.
This solution replaced the manual report running with an automated, filterable dashboard — enabling instant, presentation ready program or partner-specific reports for every clinic and hospital in the MLP network.
Benefits:
- Live data pipeline feeds the dashboard automatically
- Single Referral Source filter generates any partner's custom slides
- Consistent, accurate, and reproducible every time
- New clinic partners appear in the filter automatically
1
2
55
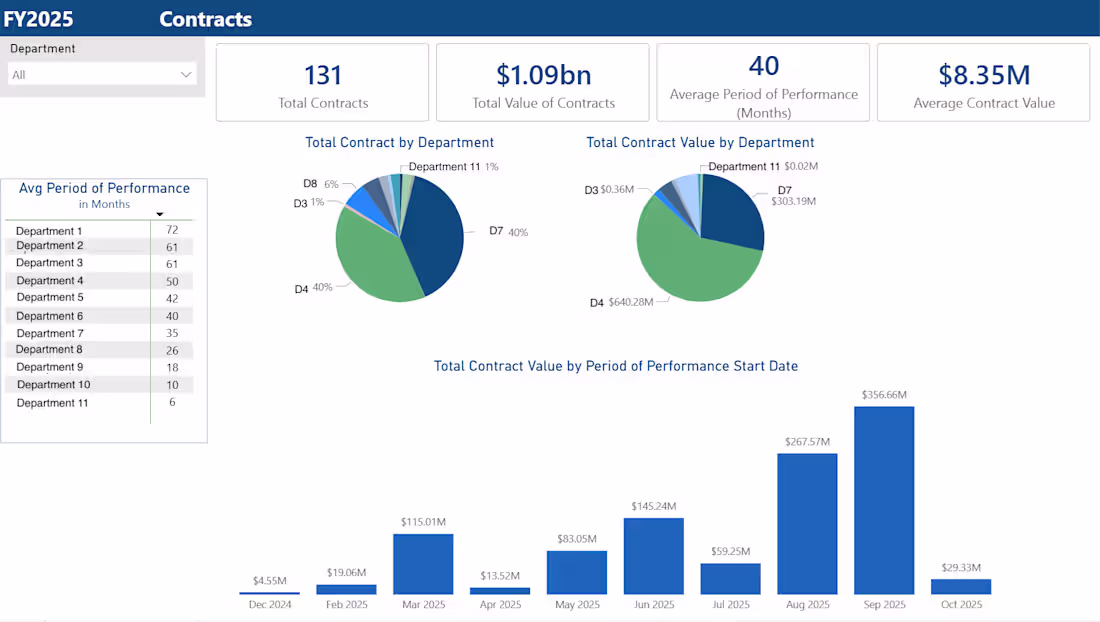
This dashboard was created to look at the distribution of federal contract awards in FY25 through a specific contracting medium. The first page is looking at all department contract awards and the second is looking at awards for one departmnt in particular and then broken out by component within that department
1
1
62
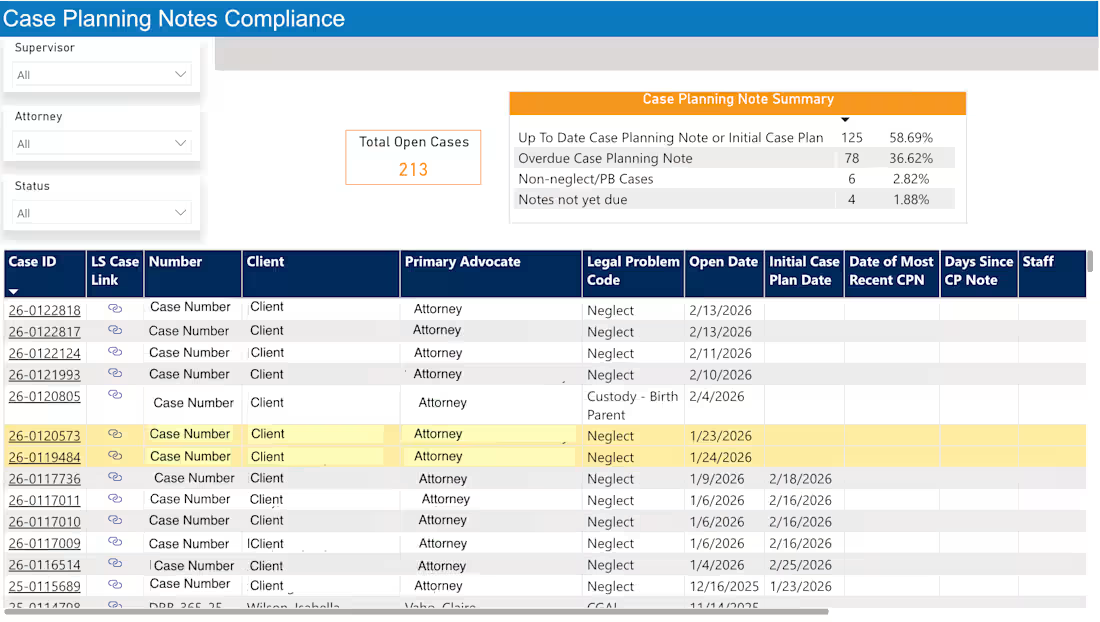
Supervisor Dashboards
These are some of the pages from a supervisor-facing management dashboard built for operational oversight rather than program reporting. Where the program dashboards track outcomes and deliverables, this dashboard tracks compliance and staff activity in real time.
0
25