
pro


Veylane Motorcare — Self-Initiated Automotive Brand Study
0
0
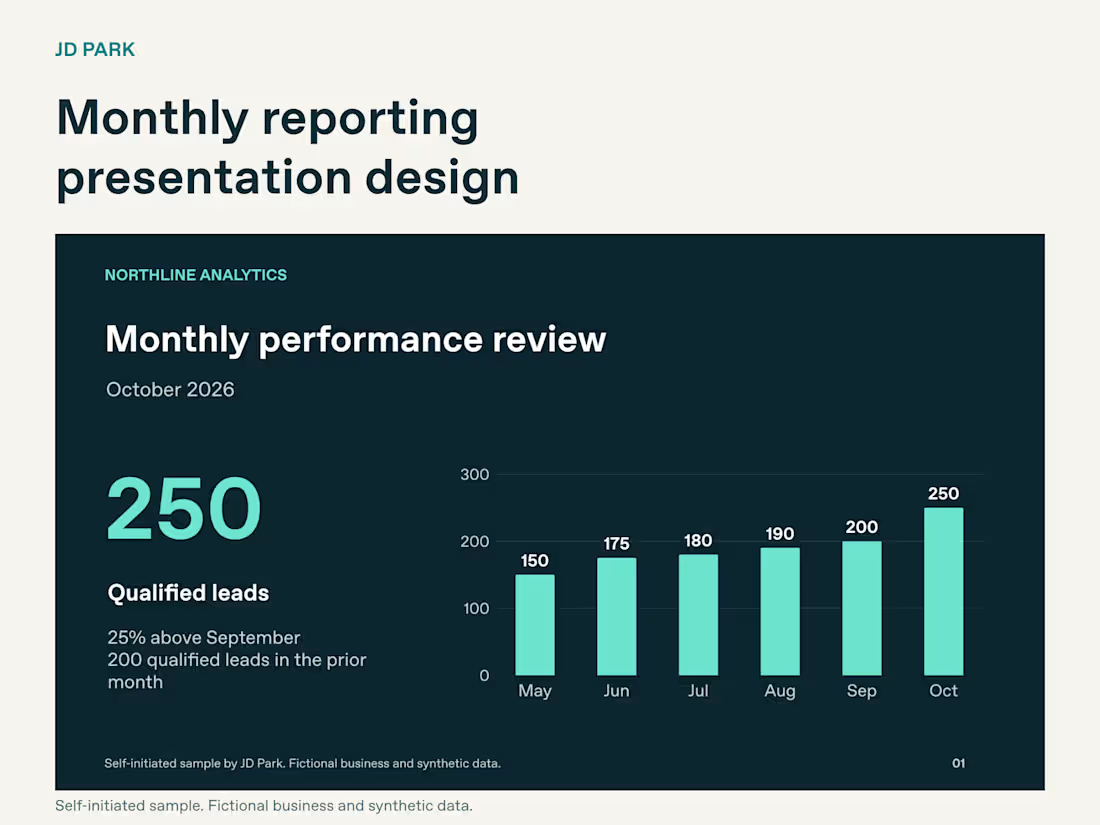
Monthly reporting decks need a clear update path. For this Northline Analytics sample, I built three slides around a reporting sequence: how performance changed, where qualified leads came from, and what the team will do next.
The source PPTX includes editable text, a native chart with an embedded data workbook, and native tables. These images are exports from that file.
One detail worth preserving in recurring reports: every percentage should keep its denominator. Here, 60% means 45 qualified leads out of 75 referral leads.
Self-initiated, AI-assisted presentation design. Fictional business and synthetic data.
When you update a monthly deck, what creates the most rework: charts, tables or layout consistency?
0
13

Presentation Redesign — Self-Initiated Concept
0
1

V17 Static — Business Landing Page Template
0
0