
pro
Jaisree Gotte
Power BI & Data Analyst | Insights through dashboards
New to Contra
Jaisree is ready for their next project!
📊 Transform Your Business Data into Actionable Insights
Most businesses collect plenty of data—but very few use it effectively.
Raw spreadsheets don't help you make faster decisions. A well-designed dashboard does.
I help businesses turn complex data into interactive, easy-to-understand dashboards using:
📊 Power BI
📈 Microsoft Excel
📉 Looker Studio
Whether it's Sales Analytics, Financial Reporting, KPI Tracking, Marketing Performance, HR Analytics, or Business Intelligence, my goal is to create dashboards that help decision-makers understand their data at a glance.
In my latest service video, I showcase how I design clean, modern dashboards that are both visually appealing and business-focused.
If you're looking for a custom dashboard or want to improve your business reporting, I'd be happy to discuss your project.
📩 Feel free to connect or send me a message.
#PowerBI #DataAnalytics #BusinessIntelligence #Dashboard #DataVisualization #MicrosoftExcel #LookerStudio #SQL #BusinessAnalytics #KPIs #Reporting #DataDriven #Analytics #BusinessReporting #Freelancer
1
23
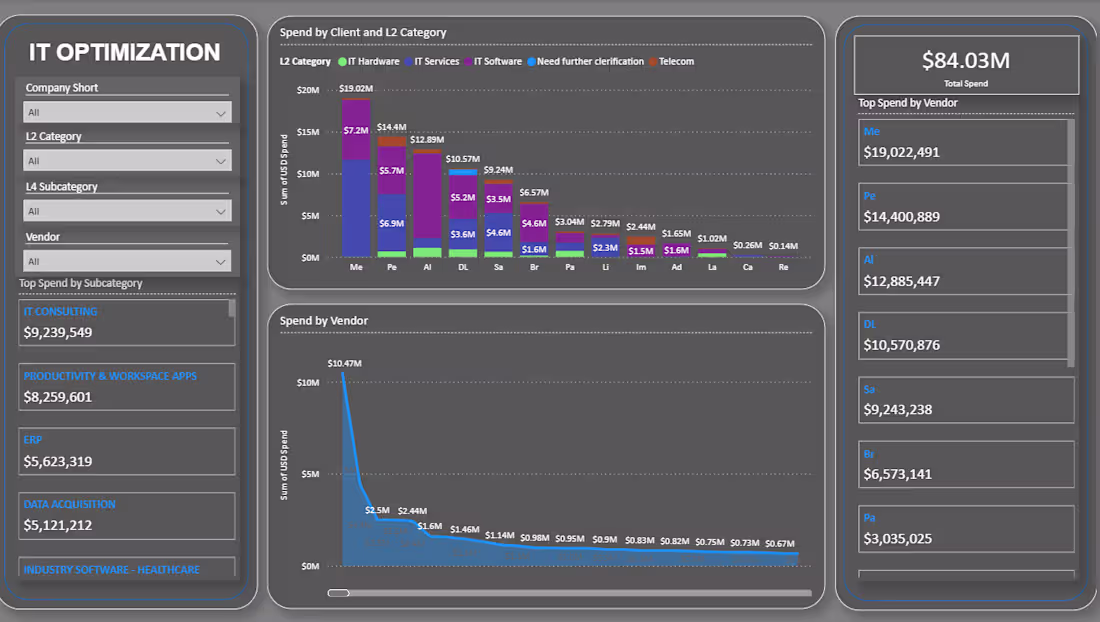
IT Spend and Optimization Report – Description
An IT Spend and Optimization Report provides a comprehensive analysis of an organization’s technology-related expenses and identifies opportunities to reduce costs, improve efficiency, and maximize the value of IT investments. The report helps management understand where IT budgets are being utilized and supports strategic decision-making for future technology planning.
1
33
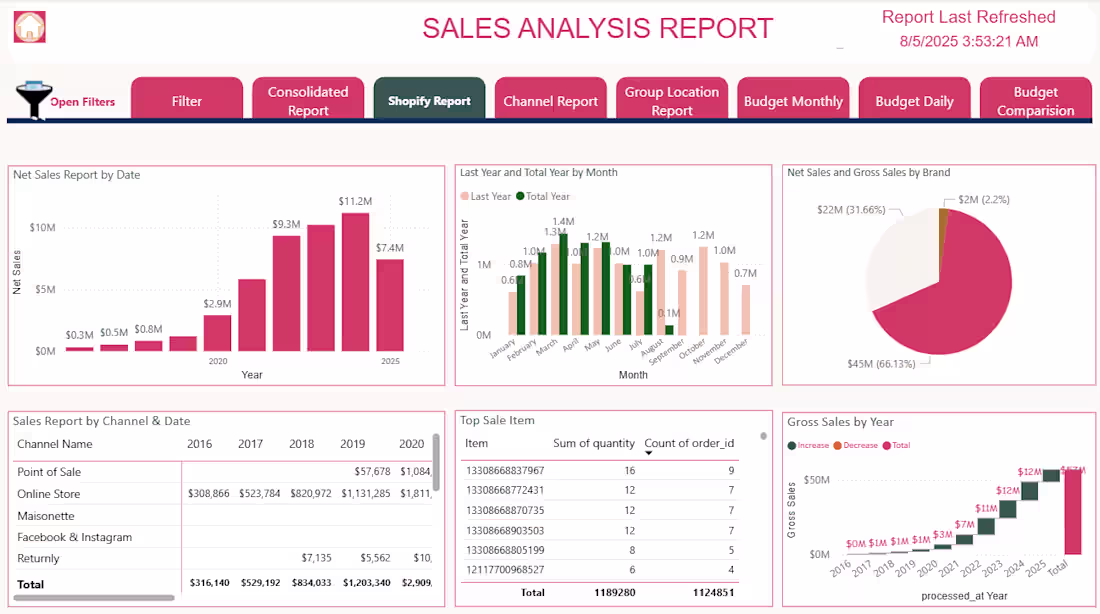
A Sales Overview Report provides a high-level summary of sales performance across products, regions, customers, and time periods. It helps businesses monitor revenue trends, evaluate sales effectiveness, and make data-driven decisions to improve profitability and growth.
1
37
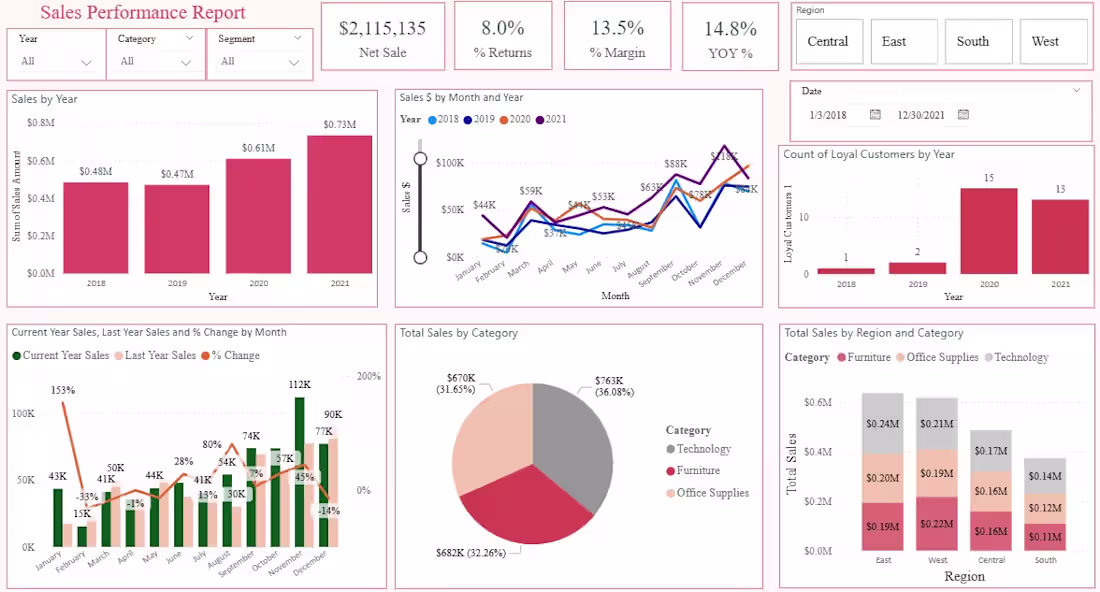
Developed a Sales Performance Dashboard in Power BI to analyze revenue trends, profit margins, and customer behavior across multiple regions and time periods.
The dashboard provides key insights into yearly and monthly sales performance, category-wise contribution, and regional distribution. It also tracks KPIs such as net sales, return rates, and year-over-year growth.
Interactive filters enable stakeholders to drill down by region, category, and date, helping identify trends, optimize sales strategies, and improve business decision-making.
0
91