
Ishe Chareka
Business Intelligence | Built on Hands-on Projects
New to Contra
Ishe is ready for their next project!

We’ve all been there. You build a beautiful, interactive dashboard, the colors are perfect, the layout is sleek... and then you realize the numbers don't add up.
While building my latest Supply Chain Intelligence Hub, I hit a wall. My visuals were "missing" data, and my profit calculations were skewed. I realized that "pretty" visuals are useless if the underlying data is a mess.
1
1
19
I completed this professional project certification through Coursera to bridge the gap between raw data analysis and operational efficiency. The focus was on identifying business needs and determining solutions to complex business problems.
Key Skills Applied
Process Mapping: Analyzing existing business workflows to identify bottlenecks and areas for optimization.
Requirements Gathering: Translating stakeholder needs into technical specifications for data-driven solutions.
Strategic Problem Solving: Using analytical frameworks to improve organizational processes and project outcomes.
How this adds value
By combining these Business Analysis fundamentals with my technical stack in SQL and Power BI, I can ensure that the dashboards and insights I build are not just "visually pleasing" but are directly aligned with improving a company’s bottom line and operational speed.
0
4
Overview:
This project is an end-to-end Business Intelligence solution that transforms 100 SKUs of raw supply chain data into a high-level strategic tool. It was born out of a "messy land" phase where I had to backtrack to MySQL and Excel to resolve encoding errors and data-type conflicts before building a responsive, three-page executive dashboard in Power BI.
The Three Pillars of the Dashboard:
Slide 1: Executive Financial Overview
Focus: Core profitability and top-line metrics.
The Big Win: I developed custom DAX measures for Net Profit and Revenue generated, identifying Skincare as the primary profit engine ($217,242). This slide serves as the "Financial Pulse" of the company.
Slide 2: Customer & Market Intelligence
Focus: Demographic spending and regional logistics.
The Big Win: By mapping revenue against location and demographics, I identified that Kolkata is our highest-volume market but suffers from a 19.4-day delivery delay. I proposed a logistics shift based on Delhi's faster 14.6-day model to unlock growth.
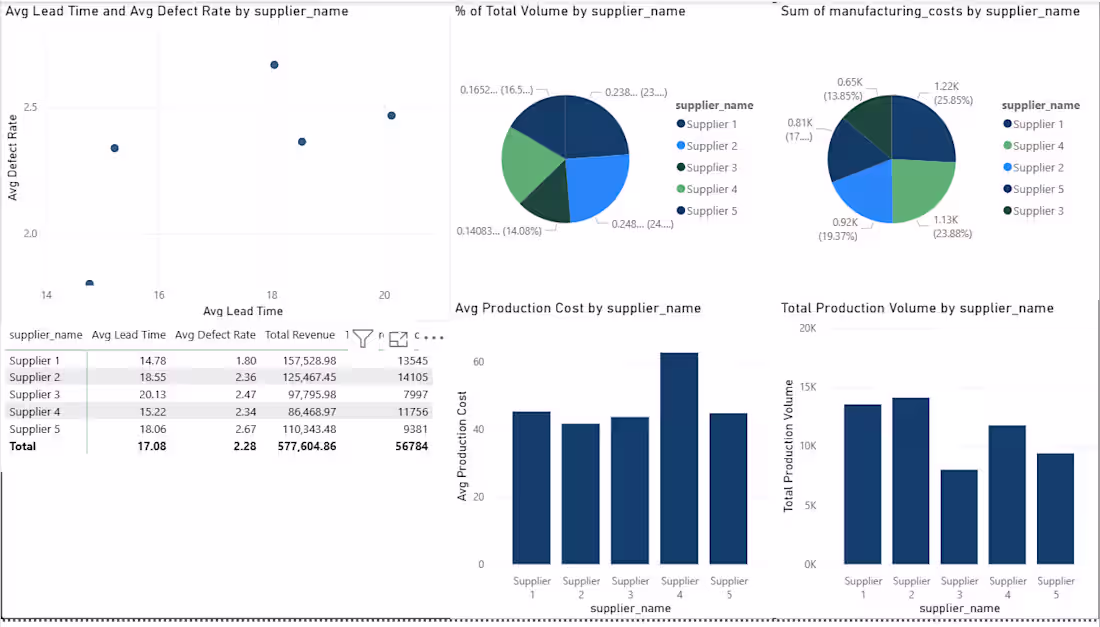
Slide 3: Supplier Risk & Quality Audit
Focus: Partner performance and manufacturing health.
The Big Win: This is the "Risk" engine. I uncovered a massive liability with Supplier 4, who carries the highest manufacturing costs ($62.71) but holds a 0% inspection pass rate. This provides an immediate, data-backed recommendation for procurement offboarding.
Technical Execution:
Data Engineering: Used MySQL to sanitize product types and create a math-ready schema, overcoming "Incorrect DECIMAL" errors that initially broke the responsiveness of the dashboard.
Advanced Analytics: Built a Weighted Defect Rate measure to identify quality outliers and a Product Affinity Heatmap to show which demographics buy which products.
UI/UX Design: Implemented a futuristic "Dark Mode" theme with neon accents and interactive slicers to allow executives to drill down into specific categories or regions instantly.
The "Jump":
This work represents a move beyond simple data reporting. It demonstrates the ability to audit one's own errors, go back to the source code to fix them, and deliver a "bulletproof" product that connects backend logistics to front-end profit.
0
9
I’m currently building out a Strategic Supply Chain Intelligence Dashboard that bridges the gap between raw database management and executive decision-making. This isn’t just about making "pretty charts" it’s about solving real-world operational bottlenecks.
Logistics Efficiency: Carrier B is our clear winner, maintaining a 5.3-day average shipping time, outperforming all others without a significant jump in cost.
Supplier Risk vs. Reward: While Supplier 1 is a model of reliability (14.8-day lead time), Supplier 5 is a major bottleneck with 18-day delays and higher-than-average defect rates.
The Quality Bottleneck: A staggering 41% of inspections are currently "Pending." This suggests that our production isn't just a manufacturing challenge, but a quality control one.
Revenue Drivers: Skincare isn't just a category; it’s our powerhouse, generating over $241K in revenue.
What I’ve achieved in this phase:
Database Engineering (MySQL): Cleaned and transformed messy supply chain data, moving past "Incorrect DECIMAL" errors and encoding issues to create a math-ready schema.
KPI Development: Built out core metrics including Net Profit, Supplier Lead Times, and Defect Rates to track manufacturing health.
Operational Intelligence: Identified that Carrier B is our logistics powerhouse (5.3-day avg), while Supplier 5 poses a significant risk to the supply chain with 18-day delays.
Advanced Visualization (Power BI): Developed a dark-themed, futuristic dashboard focused on high-level executive cards and correlation line charts.
There are still a few "pending" items to fix (like that 41% inspection bottleneck!), but this project marks the biggest "jump" in my technical journey so far. I’m staying "Locked In" to ensure the final result is bulletproof.
Tools used: 🛠️ Excel (Data Prep) 💻 MySQL (Data Analysis & Cleaning) 📊 Power BI (Business Intelligence)
0
13
Overview
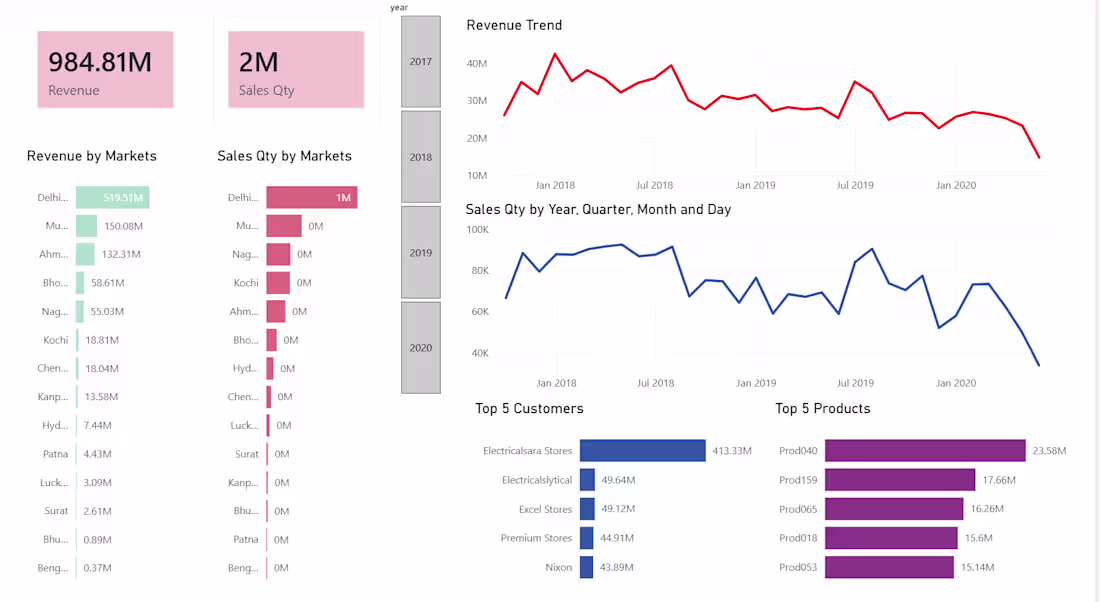
For this project, I transformed raw, fragmented sales data, from a dataset from Github, into a high-impact interactive dashboard. This wasn't just about visualization; it was about building a reliable data journey. I handled the entire process from querying the raw database to cleaning the records and finally designing a user-centric interface that identifies market leaders and revenue trends.
The Tech Stack & Workflow
• Data Extraction & Initial Cleaning (MySQL): I used SQL to extract the relevant datasets and perform the initial "heavy lifting." This involved filtering out noise and identifying structural errors within the database.
• Quality Assurance (Excel): I utilized Excel for rapid error-checking and data validation, ensuring that the numbers were accurate before moving into the visualization phase.
• Transformation & ETL (Power Query): Using Power Query within Power BI, I performed data modeling and transformation to ensure the relationship between "Revenue" and "Sales Quantity" was seamless across different timeframes.
• Visualization (Power BI): Developed an interactive UI that tracks KPIs such as Revenue Trends, Top 5 Products, and Market-specific performance.
Key Features:
• Drill-Down Capabilities: Users can filter by year (2017–2020) to see how market dynamics shifted over time.
• Market Analysis: Instant visibility into top-performing regions like Delhi and Mumbai.
• Product & Customer Insights: Side-by-side comparisons of the top 5 revenue-generating products and customers.
Strategic Improvements:
While the dashboard provides a clear historical view, I have identified the following areas for future optimization to provide even deeper business value:
Profit Margin Analysis: Integrating "Cost of Goods Sold" (COGS) to move from tracking Revenue to tracking actual Profitability.
Predictive Forecasting: Implementing DAX-based forecasting to predict future sales trends based on the 2017-2020 historical data.
Data Label Optimization: Refining display units for smaller markets to ensure granular visibility across all regions.
0
20