
Israel Chesa
Power BI & Excel Analyst | Automated Business Reporting
New to Contra
Israel is ready for their next project!
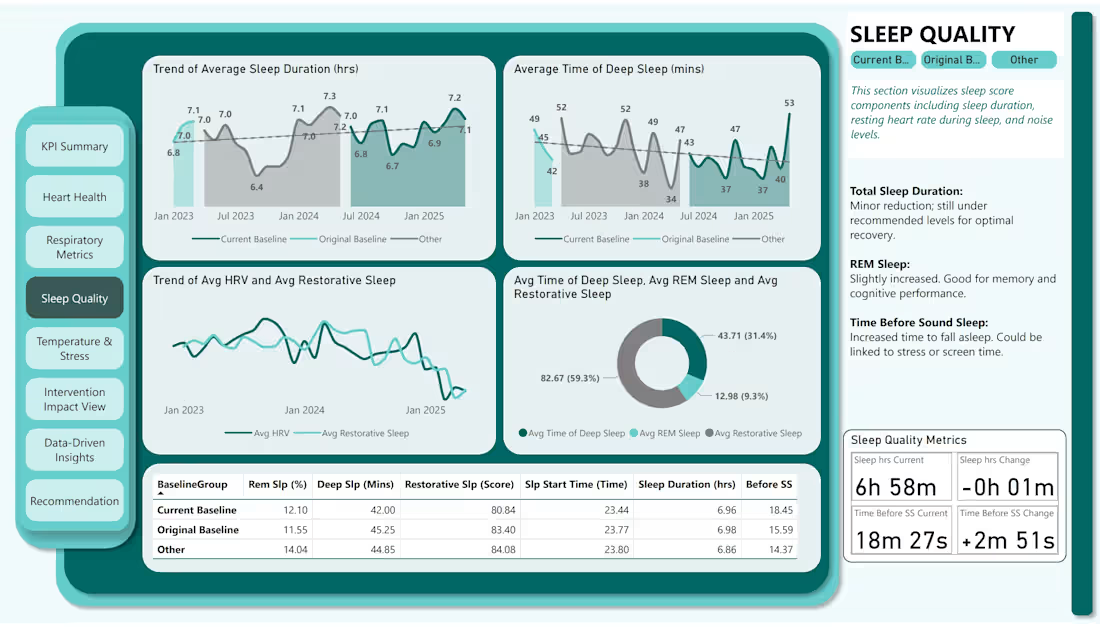
Analyzed a 12-sheet Fitbit dataset to compare two health baselines and identify changes in heart-rate variability, respiratory rate, sleep, readiness, stress, temperature and SpO₂. I cleaned, aligned and validated the source data in Excel, then used Power BI to visualize trends and distinguish persistent patterns from day-to-day variation. The final report translated the findings into clear, non-medical insights showing how lifestyle and treatment changes related to recovery, sleep and overall wellbeing.
1
24
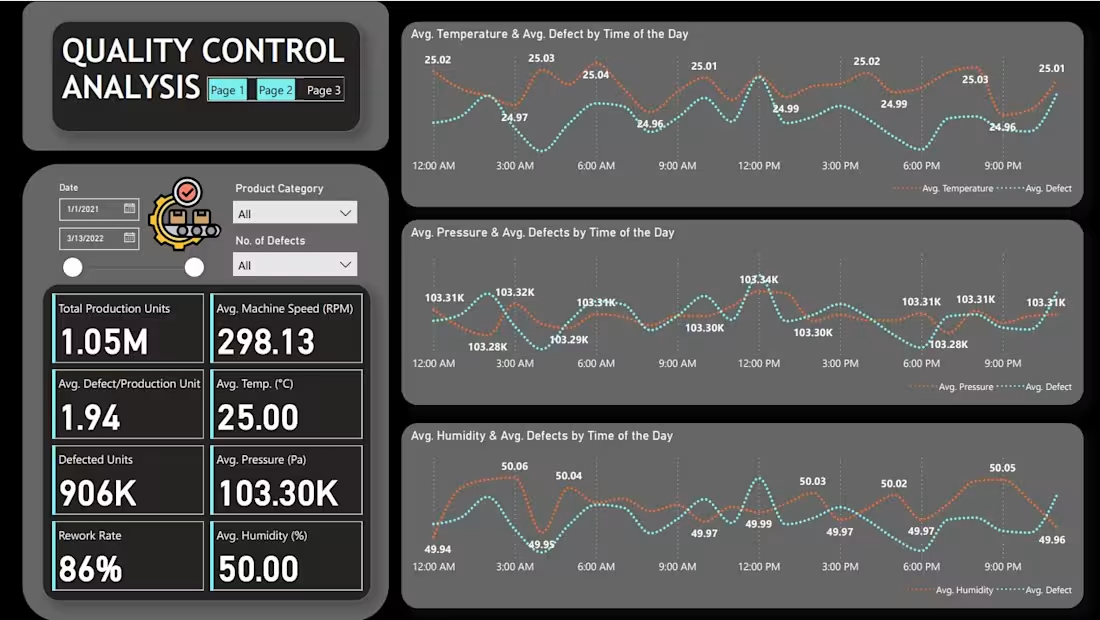
Analyzed manufacturing data to identify the factors affecting defects, first-pass yield and rework across shifts and product categories. I applied Six Sigma and statistical process control methods, examined machine-speed and environmental variation, and built a Power BI dashboard for ongoing monitoring. The analysis supported planned machine-rest periods to reduce wear, contributing to a 25% reduction in rework and a more stable quality-control process.
1
7
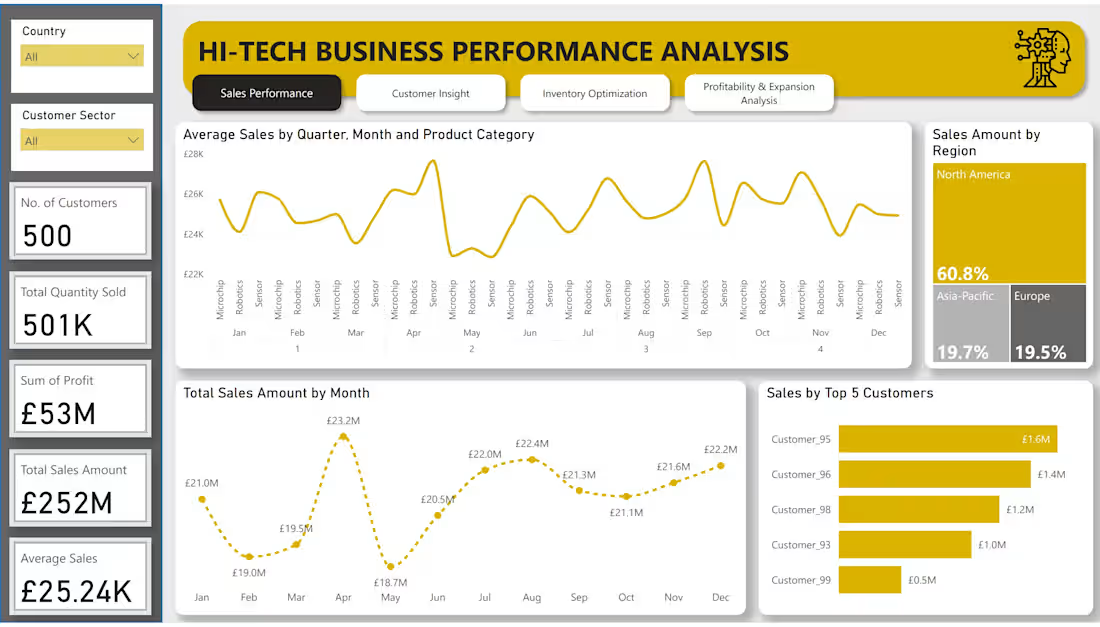
Built a multi-page Power BI solution to evaluate sales, customers, inventory, profitability and expansion opportunities across automotive, consumer electronics and industrial products. I transformed and modeled the data, created measures for sales, profit, margin and production cost, and designed interactive views for regional, seasonal and customer analysis. The work highlighted recurring sales peaks, North America's 60.8% share and a 37.6% industrial-sector profit margin, supporting clearer commercial and operational decisions.
1
22
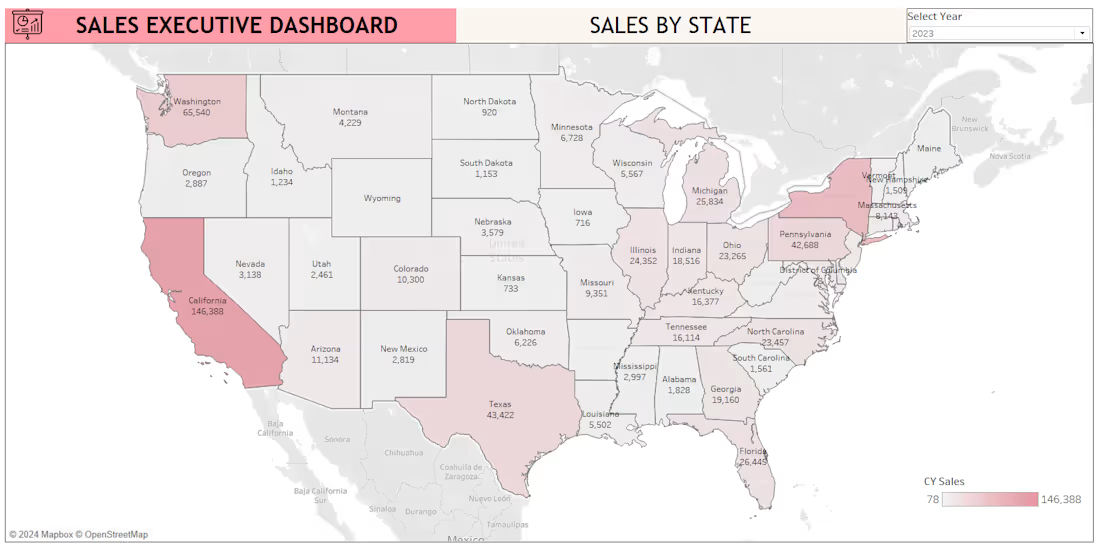
Created an executive Tableau dashboard to compare current- and prior-year sales and profit across product categories and US states. I used SQL to prepare the dataset and built interactive KPI, trend, geographic and category views for management reporting. The dashboard identified 20.36% year-over-year sales growth and 14.24% profit growth while exposing underperforming states and product lines, enabling users to move from headline performance to the areas requiring attention.
1
10