
Isaac Njuguna
Economics&Statistics Grad|Excel, SQL & Power BI Data Analyst
New to Contra
Isaac is building their profile!
This project is a continuation of my SQL Data Job Analysis work and is built directly on top of the SQL queries and analytical logic developed in my earlier repository. You can view the original SQL analysis here: https://github.com/stevedatalabs/SQL_Project_Data_Job_Analysis
In this stage, the focus shifts from raw SQL analysis to visual storytelling. The project takes the query outputs and structured insights from SQL and transforms them into an interactive visual format to make the findings easier to interpret and explore.
The analysis covers key areas such as skill demand, salary potential, and an optimal ranking system that combines both factors to identify the most valuable skills for remote data analyst roles. This creates a full end-to-end workflow from data extraction and transformation in SQL to insight visualization and interpretation.
Overall, the project demonstrates a complete data pipeline: SQL-based data analysis → structured insight generation → visualization for decision-making and storytelling.
You can view the interactive dashboard here:
https://app.powerbi.com/groups/me/reports/fad5b484-e1b6-448e-aff6-984469be2961/83695d22fb12a14b205e?experience=power-bi
1
16
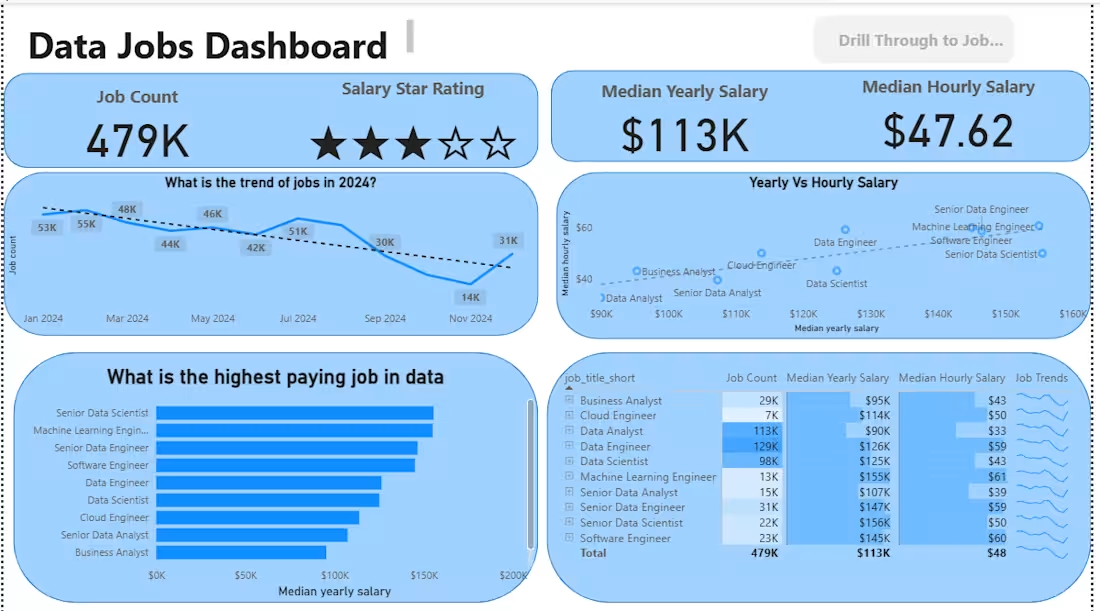
This project is an interactive Power BI dashboard built using 2024 data job posting data from Datanerd.tech (http://Datanerd.tech) to explore trends within the data job market. The dashboard analyzes salaries, hiring platforms, remote work opportunities, and job distribution patterns to help job seekers, aspiring analysts, and career transitioners better understand the industry.
The project consists of two interactive pages. The main dashboard provides a high-level overview of the data job market through visual analysis of salaries, job postings, and hiring trends. A dedicated deep dive page allows users to drill through into specific job titles for more detailed insights, including salary distributions, work-from-home statistics, top hiring platforms, and geographic job distribution through an interactive Azure map.
This project demonstrates skills in data visualization, dashboard design, drill-through navigation, data storytelling, and interactive analytics using Power BI. It also reflects my interest in using data to uncover practical insights that support better career and business decisions.
You can view the full project and detailed README on GitHub here:
https://github.com/stevedatalabs/Power_BI_Dashboards/tree/main/Data_Jobs_V1
1
26
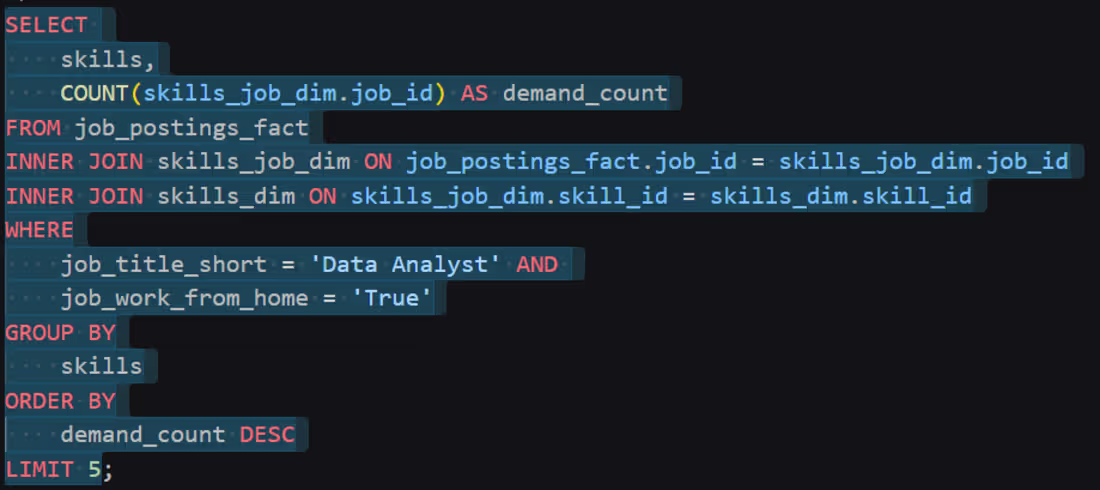
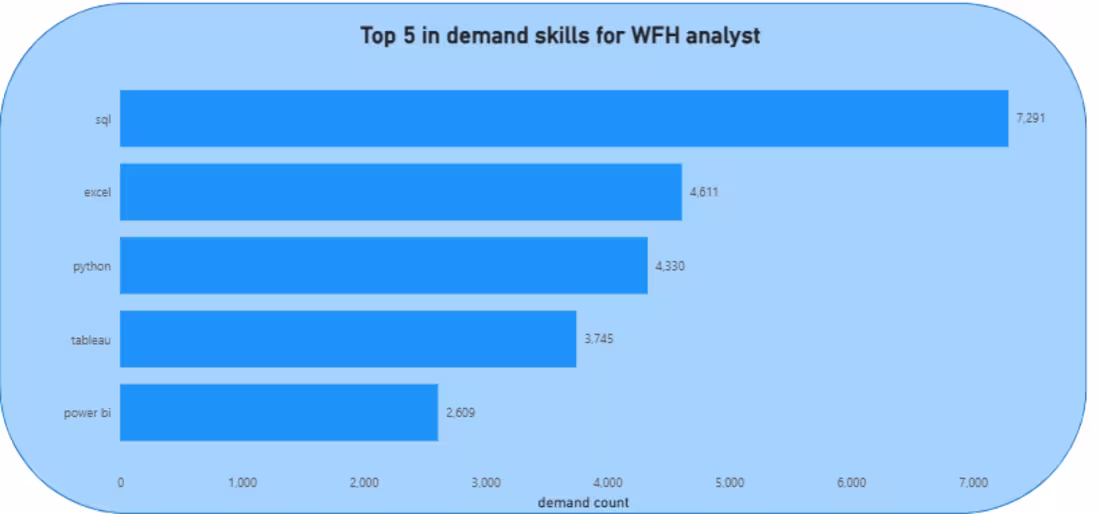
This project explores the data analyst job market using SQL to uncover insights on salaries, in-demand skills, and remote work opportunities. Through a series of analytical SQL queries, the project investigates trends in job postings, identifies the highest-paying roles and skills, and examines the relationship between skill demand and compensation.
The analysis was conducted using PostgreSQL and focused on transforming raw job posting data into actionable insights through data cleaning, aggregation, joins, CTEs, and advanced querying techniques. The project demonstrates practical SQL skills while answering real-world business and career-oriented questions within the data analytics industry.
You can view the full project, SQL queries, and analysis on my GitHub portfolio:
https://github.com/stevedatalabs/SQL_Project_Data_Job_Analysis
1
31
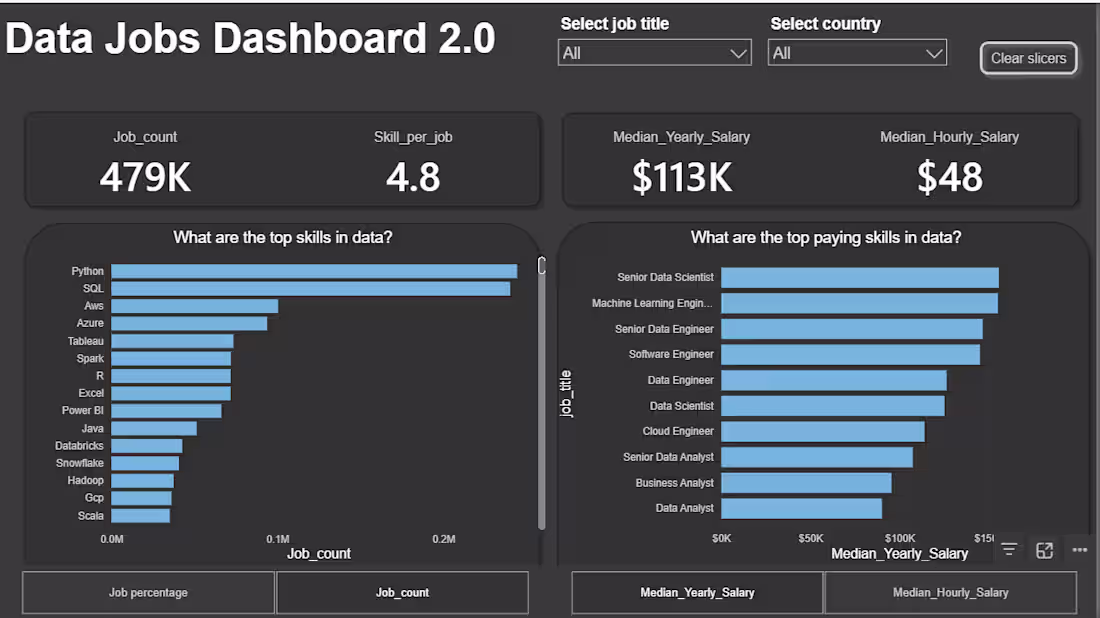
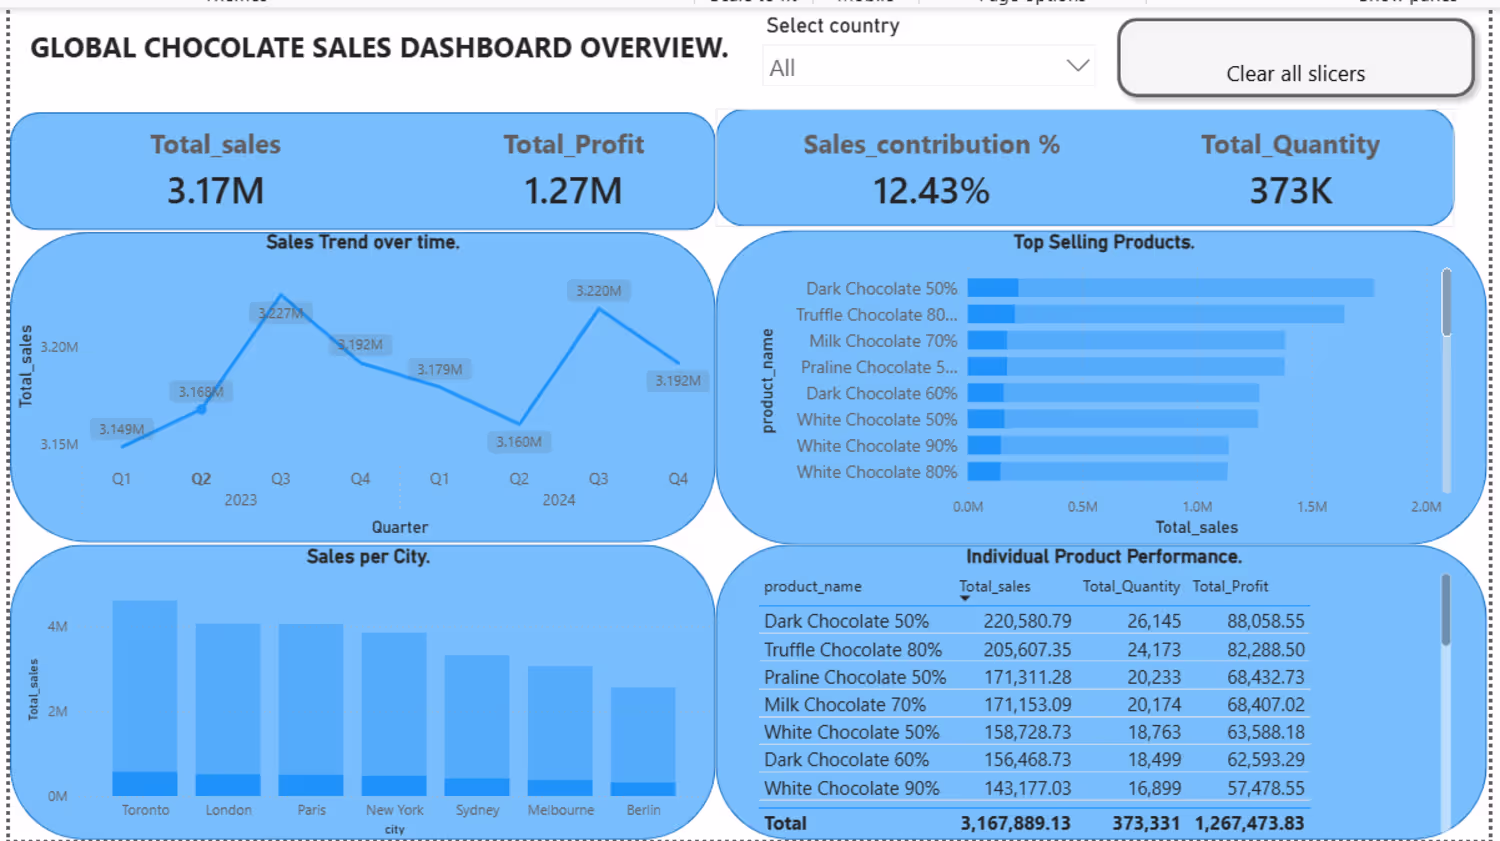
This second version improves on the initial dashboard by consolidating insights into a single focused view, designed for fast and efficient exploration of the most important metrics in the job market.
Key highlights include:
Job market KPIs such as total job count, median yearly and hourly salaries, and skills per job
Skill popularity analysis based on job frequency and demand
Salary comparisons across different job titles
A strong focus on skills required per job role — a key improvement from the first version, which did not fully capture this dimension
You can view the full project and detailed README on GitHub here:
https://github.com/stevedatalabs/Power_BI_Dashboards/tree/main/Data_Jobs_V2
1
34