
Huzaifa Moin
Power BI Developer Turning Data into Actionable Insight
New to Contra
Huzaifa is building their profile!
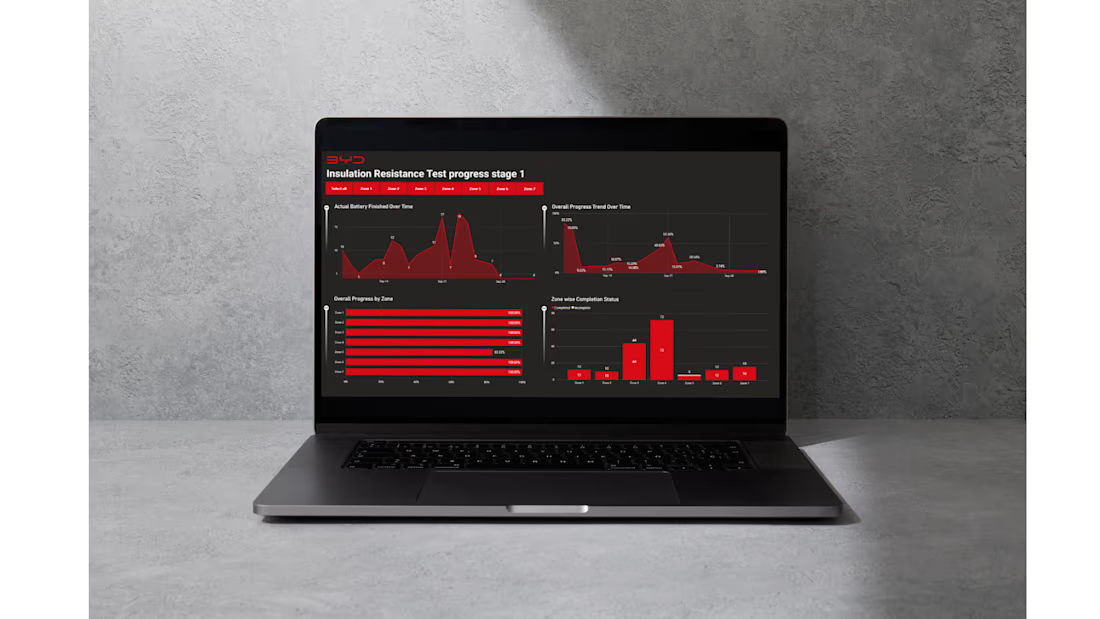
BYD Cover Installation Progress Dashboard | Project Management (Sep 2025)
Built a Power BI progress tracking dashboard for a BYD cover installation project spanning 7 zones. The dashboard surfaces real-time completion rates by zone, daily installation counts, and cumulative progress trends to give project managers a clear picture of where work is on track and where it is stalled.
Key findings surfaced by the dashboard: Zones 5 and 6 are fully complete and Zone 7 is at 98.75%, while Zones 1, 2, and 3 have not started — creating a visible backlog risk. Daily output has been highly volatile, with peaks of 680 installations and multiple zero-progress days, pointing to either work stoppages or reporting gaps.
The dashboard enabled the team to identify resource reallocation opportunities from completed zones, investigate zero-progress days, and prioritize initiation of the three unstarted zones to protect the delivery timeline.
0
3
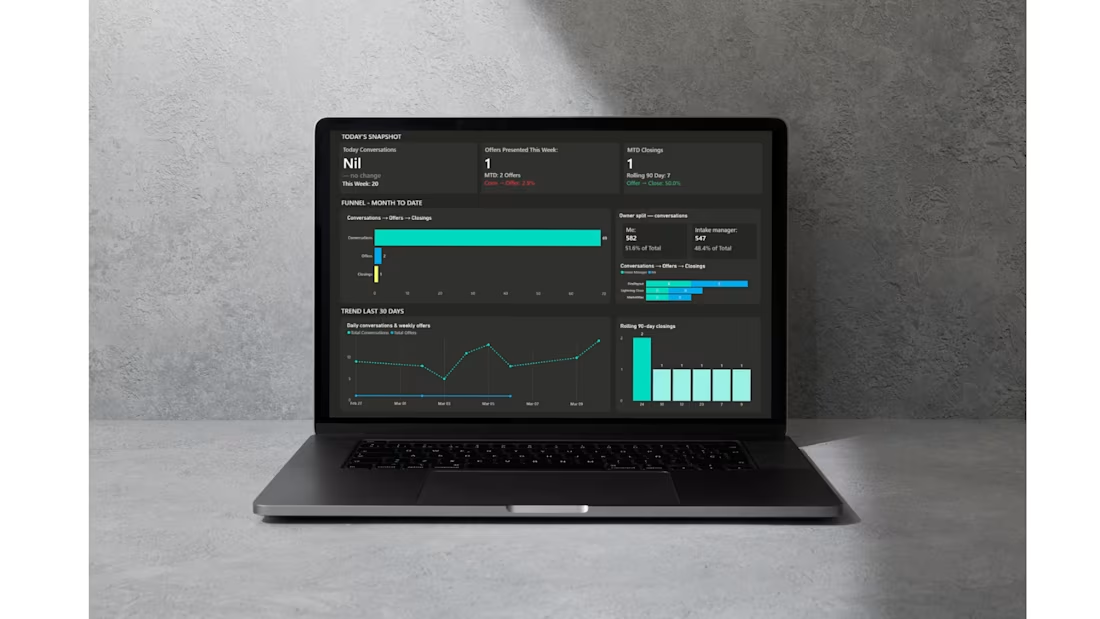
Operator Scoreboard — Power BI Dashboard
Built a real-time operator scoreboard in Power BI to track the core revenue activity chain for a real estate acquisitions business. The dashboard monitors three metrics — Seller Conversations (daily), Offers Presented (weekly), and Deals Closed (monthly) — and visualizes them as a live funnel with conversion rates at each stage.
Key features include dynamic KPI cards with vs-yesterday trend indicators, a custom horizontal funnel chart with conv→offer and offer→close rates, offer type breakdown by Lightning Close, FlexPayout, and MarketMax, owner-level drill-down between two operators, and a 30/90-day trend view with a rolling closings chart. All visuals respond to a period slicer covering This Month, This Week, Last 30 Days, and Last 90 Days.
Built entirely with DAX including time intelligence measures, VAR-optimized calculations, and conditional formatting via field value color measures.
0
7
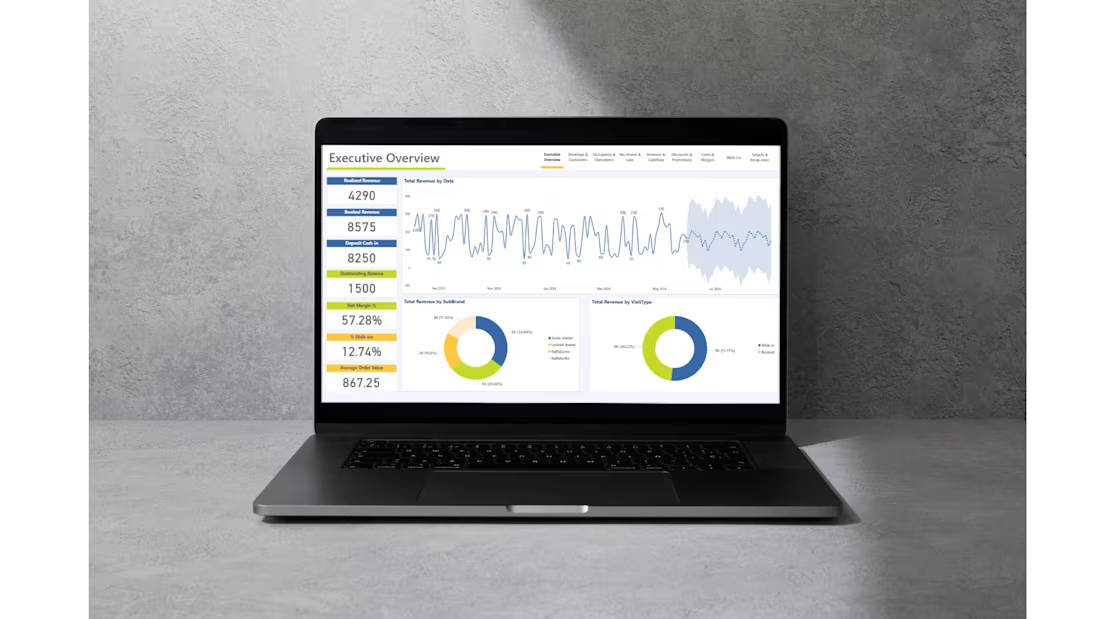
Business Intelligence Dashboard | Beauty Studio (Rotterdam, Netherlands)
Built a full BI solution for a multi-brand beauty studio in Rotterdam covering 4 service brands.
What I delivered:
Google Sheets data layer with structured tabs, input validation, and VA-friendly design
9-page Power BI report covering revenue, occupancy, no-shows, margins, promotions, and break-even tracking
30+ DAX measures including realized revenue, occupancy rate, gross and net margin, and target trackers
MySQL-style data modeling with relationships across bookings, employees, chairs, services, and expenses
Automated daily refresh via Power BI Service connected to Google Sheets
Export presets and bookmarks for 1-click PDF and PPT reporting
Tools used: Power BI, DAX, Google Sheets, Power Query
0
11
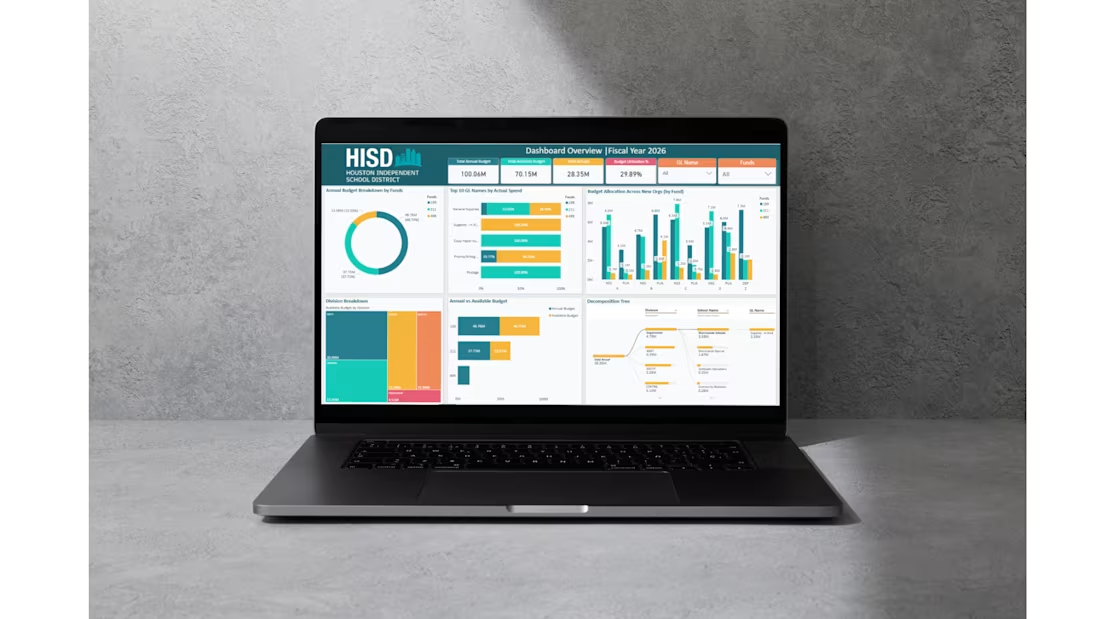
Budget Overview Dashboard | Education Sector (Sep 2025)
Built for Houston ISD's Fiscal Year 2026 budget, this dashboard tracks a total budget of $100.06M across three funds, with a current utilization rate of 29.89%.
It covers fund-level breakdowns, top expenditure categories, division-wise allocations, and an interactive decomposition tree for drill-down analysis.
Built in Power BI. Data sourced from real district financial records.
0
21