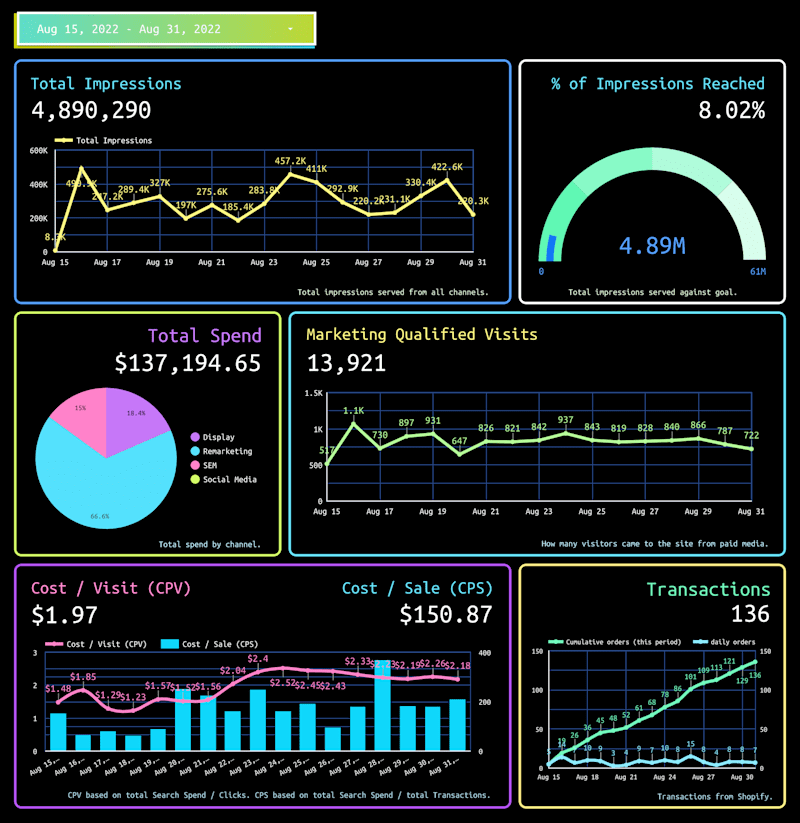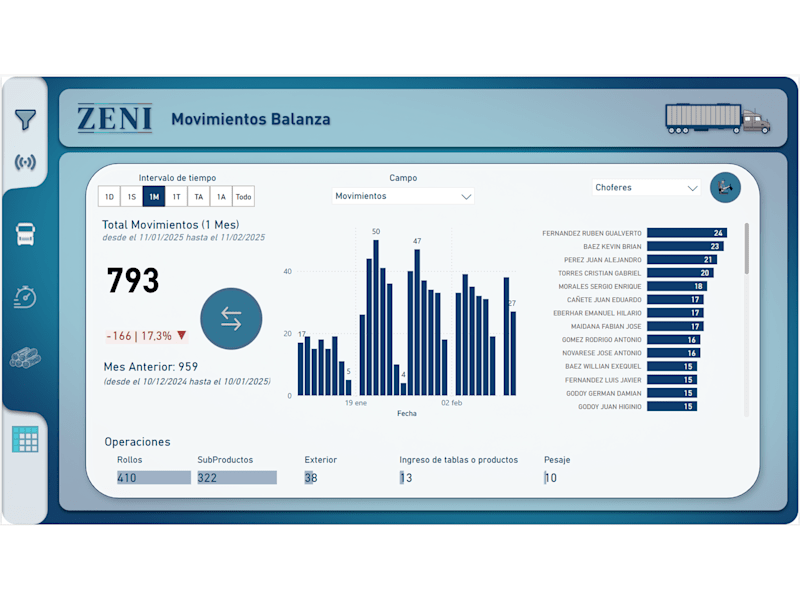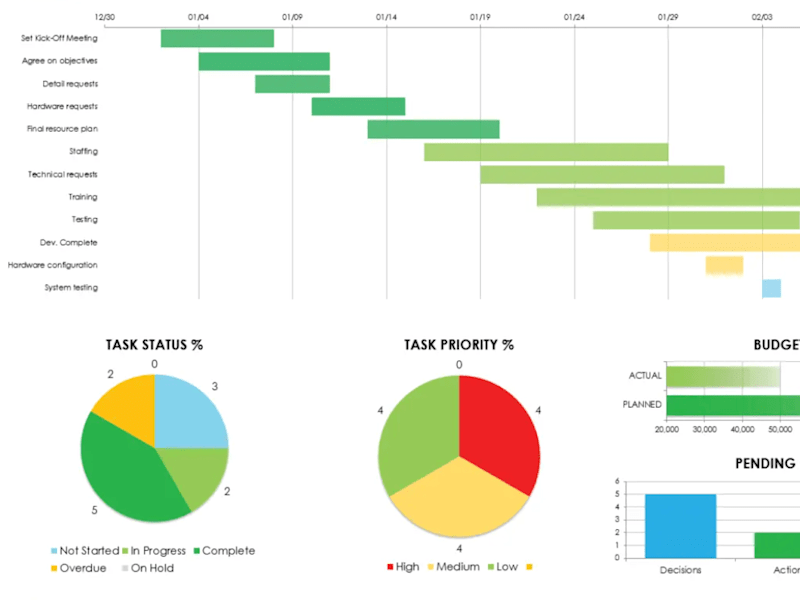


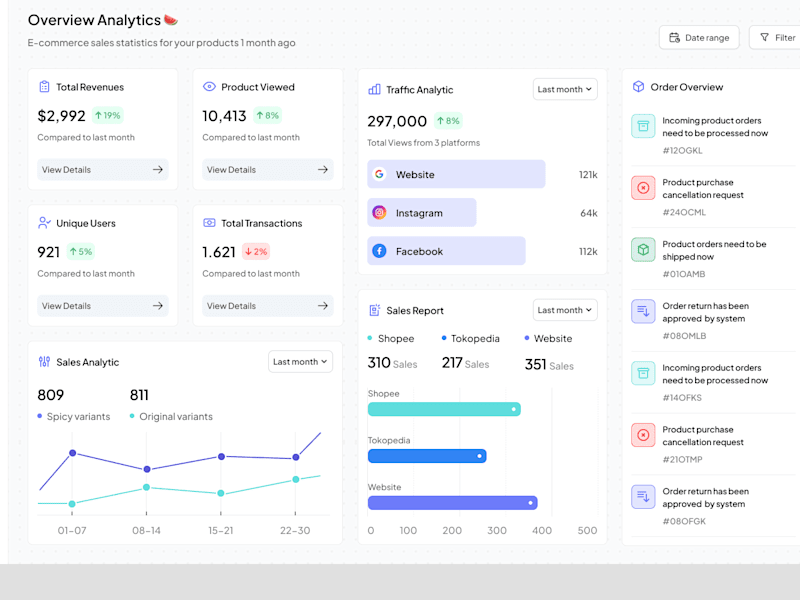
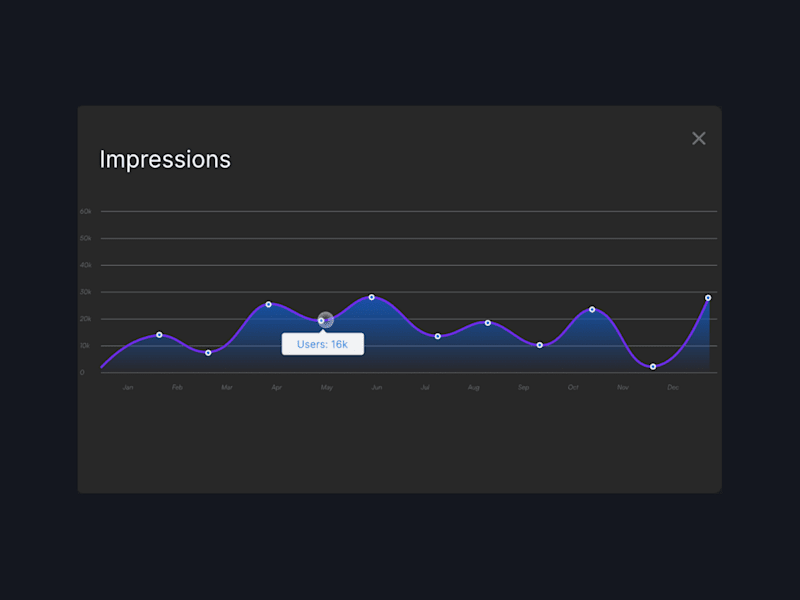
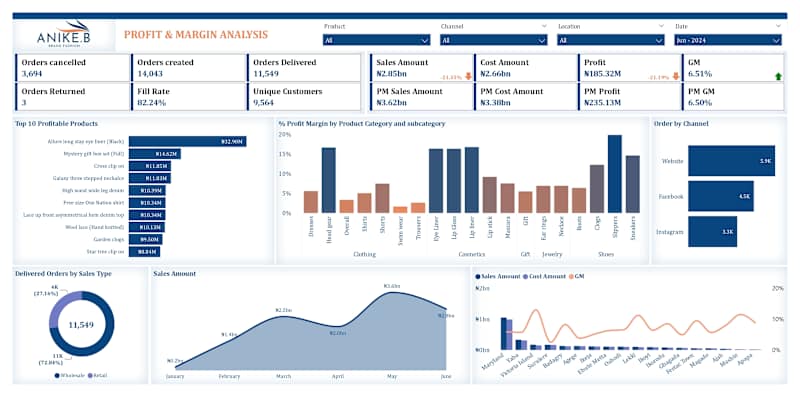
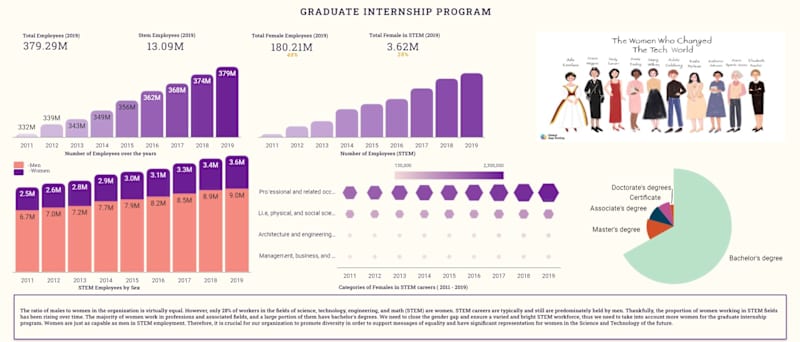
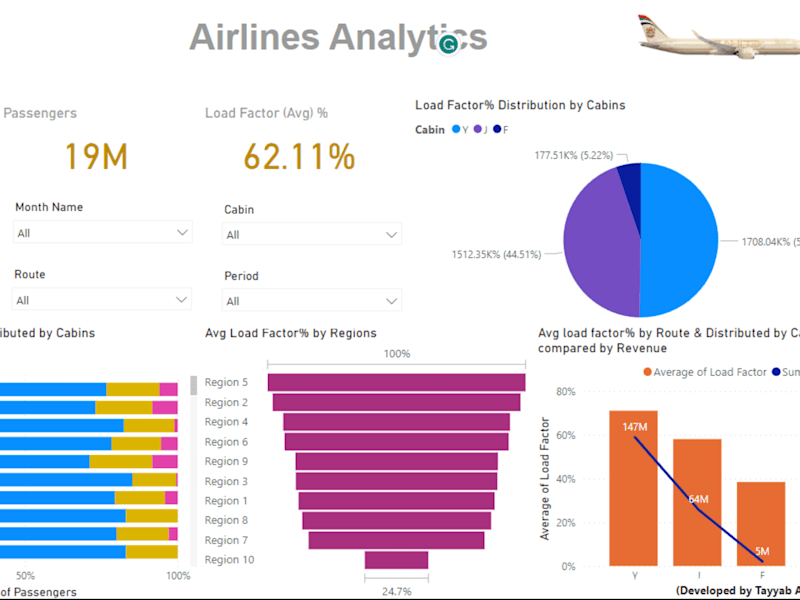
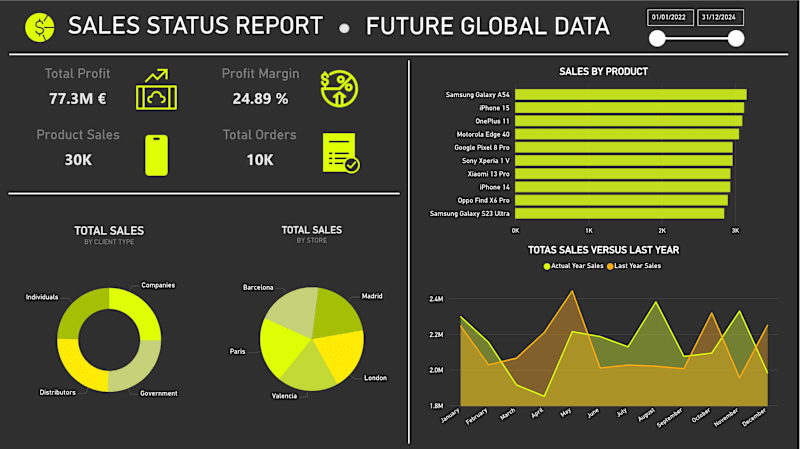
What do I want the data to show in the visualizations?
Think about the story you want your data to tell. Are you looking to show trends, patterns, or comparisons? Knowing this will help you describe your needs clearly to a data visualizer.
What is my project's deadline for the data visualizations?
Decide when you need the visualizations completed. Setting a timeline helps both you and the data visualizer plan better. This ensures that the project runs smoothly and meets your expectations.
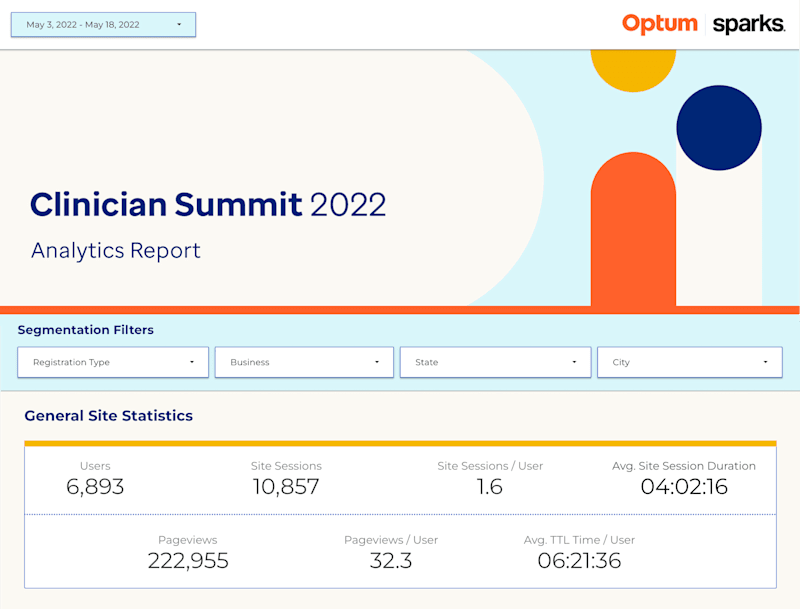
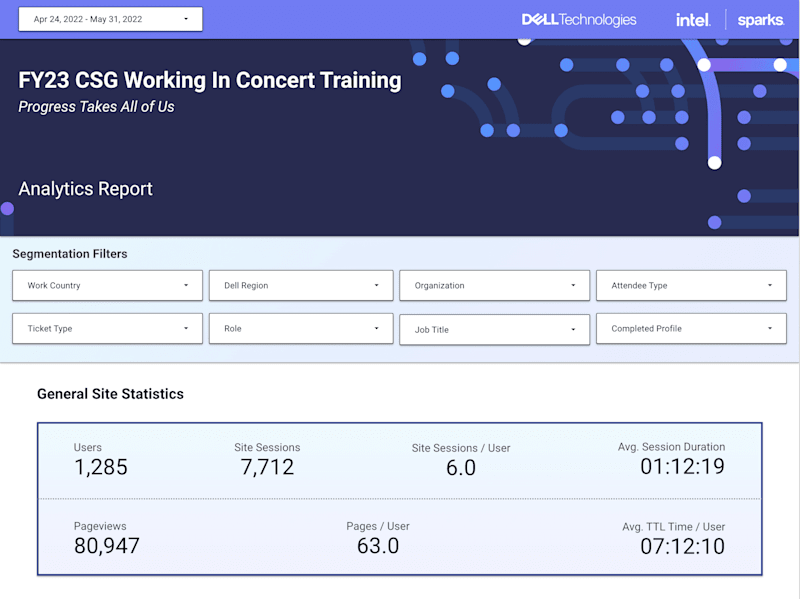
What format do I need the data visualizations in?
Determine if you need files as PDFs, images, or interactive online charts. This will guide the freelancer in creating visualizations that fit your usage needs. Clear communication of format expectations helps avoid unnecessary revisions.
How will I evaluate the data visualization styles?
Decide on criteria like clarity, creativity, and accuracy for judging the visuals. This assists in making sure the selected visualizer matches your project's goals. Having set criteria makes it easier to achieve your desired outcome.
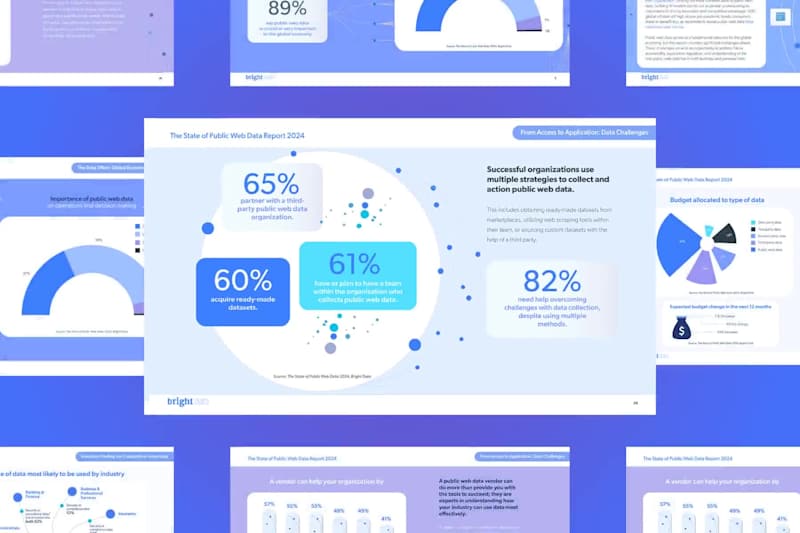
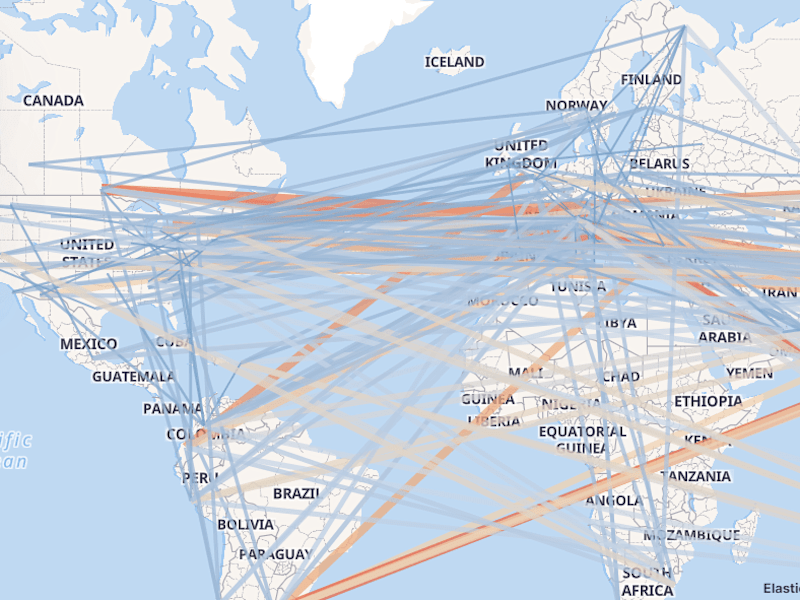
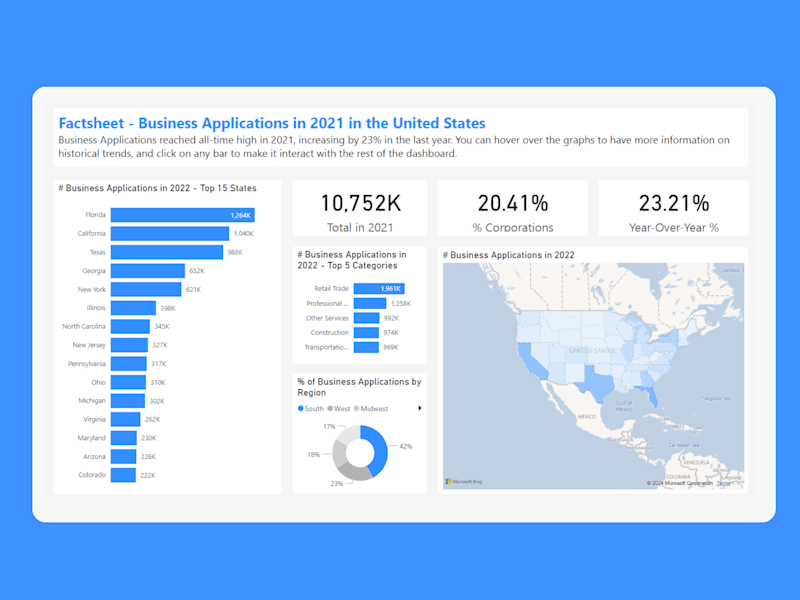
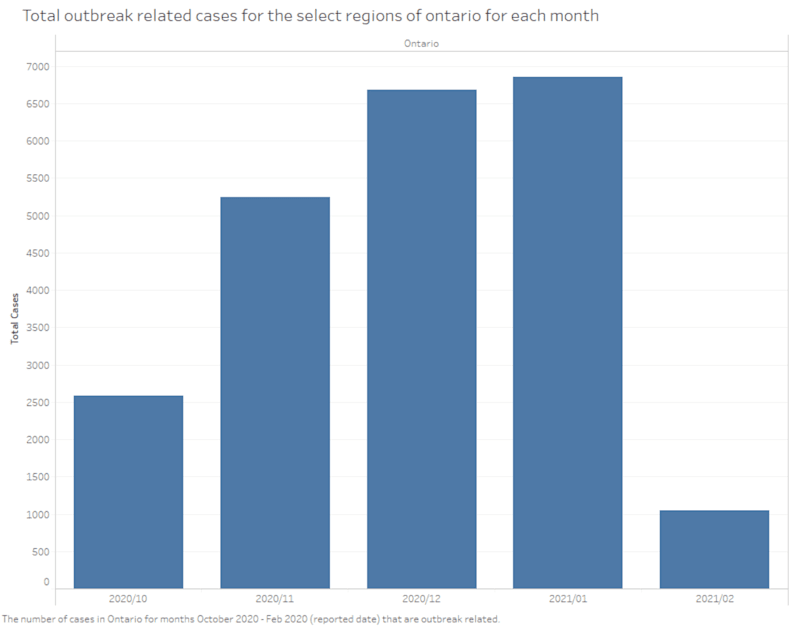
How much data needs to be visualized?
Assess the volume and complexity of your data that will go into visualizations. This will inform the freelancer about the scope of work. Knowing the amount of data helps in planning a realistic timeline.
What is my budget for the data visualization project?
Set a budget that covers quality expectations and project scope. Budget planning ensures you find a data visualizer within your financial range. It also helps avoid planning surprises.
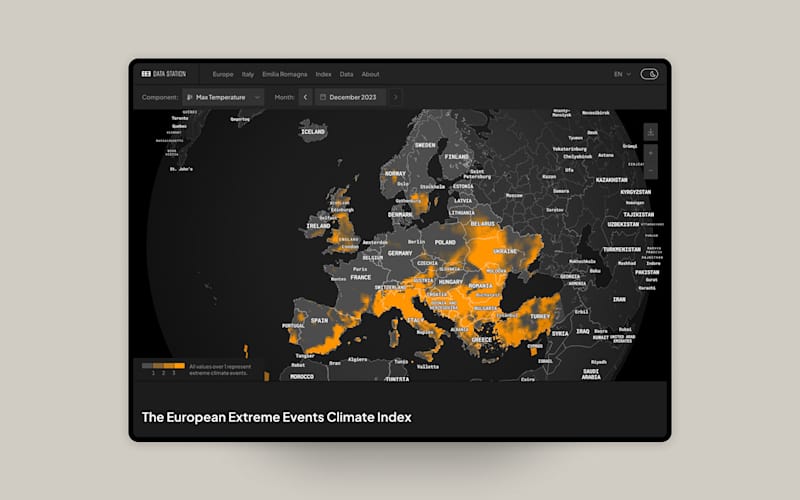
What tools or software do I prefer for the data visualizations?
Identify any specific software requirements, like Tableau or Microsoft Excel. This can influence the freelancer's approach to creating visualizations. Compatibility with your preferred tools makes integration smoother.
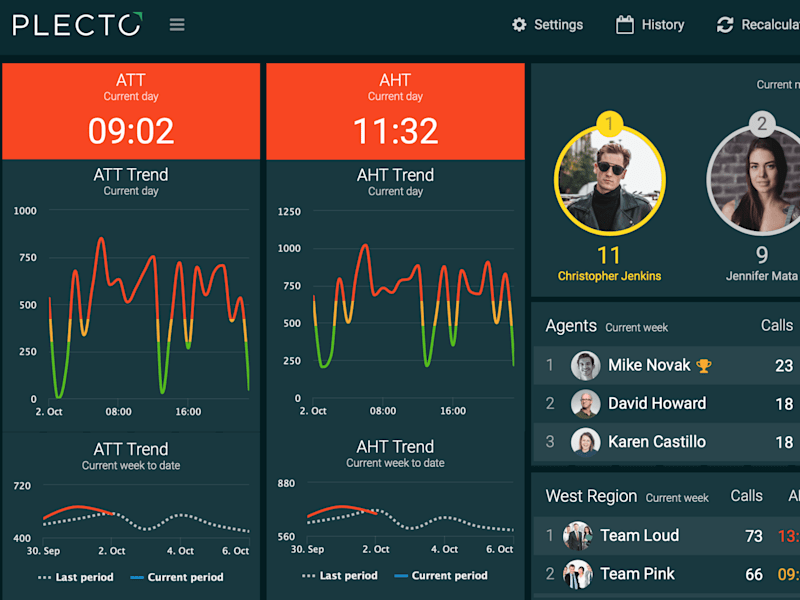
How important is interactivity in the visualizations?
Decide if you want static images or interactive features in your data visualizations. Interactivity can enhance user engagement with the data. Knowing this helps the allocator plan their approach.
How should I communicate feedback during the project?
Plan how you will give feedback, like through regular check-ins or milestone updates. This strategy ensures that your vision aligns with the data visualizer’s output. Clear communication keeps the project on track.
What is the main message I want my audience to understand?
Focus on the key insights you wish to convey through the visuals. This helps the data visualizer emphasize important information. Clarifying the main message ensures the visuals serve their purpose effectively.
Who is Contra for?
Contra is designed for both freelancers (referred to as "independents") and clients. Freelancers can showcase their work, connect with clients, and manage projects commission-free. Clients can discover and hire top freelance talent for their projects.
What is the vision of Contra?
Contra aims to revolutionize the world of work by providing an all-in-one platform that empowers freelancers and clients to connect and collaborate seamlessly, eliminating traditional barriers and commission fees.

- $50k+
- Earned
- 32x
- Hired
- 5.0
- Rating
- 90
- Followers
Top

- $1k+
- Earned
- 1x
- Hired
- 5.0
- Rating
- 2
- Followers

- $10k+
- Earned
- 24x
- Hired
- 4.9
- Rating
- 296
- Followers
Top


- $25k+
- Earned
- 9x
- Hired
- 5.0
- Rating
- 16
- Followers


- $5k+
- Earned
- 1x
- Hired
- 5.0
- Rating
- 3
- Followers


![Cover image for [Case Studies] How I helped startups with product growth](https://media.contra.com/image/upload/w_800,q_auto/uxiibfbxkk1up1hgpv6k)