
Himansh Upadhyay
BI Developer & Dashboard Consultant | SQL Expert | AI Expert
New to Contra
Himansh is ready for their next project!

Himansh Upadhyay – Data Warehouse & Analytics Project
Welcome to the Himansh Upadhyay Data Warehouse and Analytics Project 🚀 This repository demonstrates a complete end-to-end data warehousing and analytics solution, from raw data ingestion to business-ready analytics.
This project is designed as a portfolio project and highlights industry best practices in:
Data Engineering
Data Warehousing
ETL Pipelines
Data Modeling
Analytics & Reporting
📐 Data Architecture
This project follows the Medallion Architecture with Bronze, Silver, and Gold layers.
Architecture Layers
Bronze Layer
Stores raw data as-is from source systems
Data is ingested from CSV files into SQL Server
No transformations applied
Silver Layer
Data cleaning, validation, and standardization
Removal of duplicates and data quality issues
Prepared for analytical processing
Gold Layer
Business-ready data
Modeled using Star Schema
Optimized for reporting and analytics
📌 Project Overview
This project covers the full lifecycle of a modern data warehouse:
Data Architecture
Designing a modern warehouse using the Medallion Architecture
ETL Pipelines
Extracting, transforming, and loading data from source systems
Data Modeling
Creating fact and dimension tables optimized for analytics
Analytics & Reporting
SQL-based insights for business decision-making
Skills Demonstrated
SQL Development
Data Architecture
ETL Pipeline Development
Data Modeling
Data Analytics
🏗️ Project Requirements
Building the Data Warehouse (Data Engineering)
🎯 Objective
Develop a modern data warehouse using SQL Server to consolidate sales data and enable analytical reporting.
📋 Specifications
Data Sources
Two source systems: ERP and CRM
Data provided as CSV files
Data Quality
Clean and resolve data quality issues before analysis
Integration
Combine ERP and CRM data into a single analytical data model
Scope
Focus on the latest available data
No historical data versioning required
Documentation
Clear documentation for business users and analytics teams
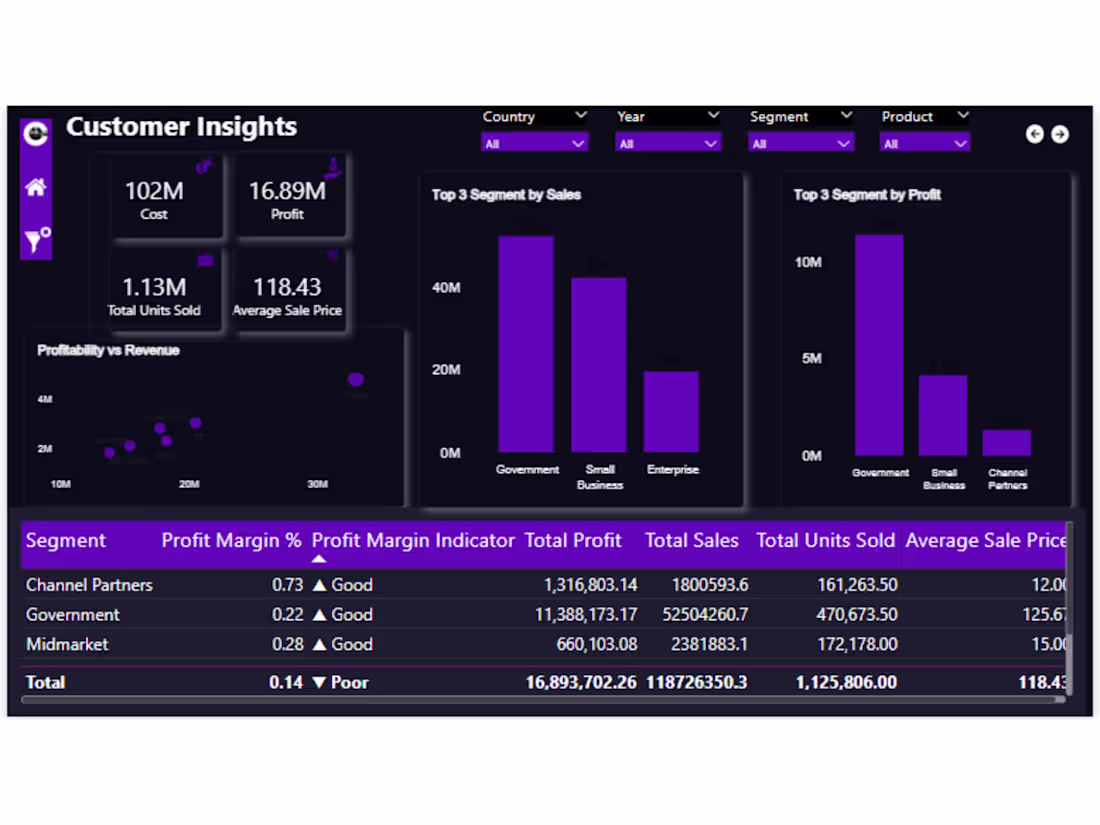
📊 BI: Analytics & Reporting (Data Analysis)
🎯 Objective
Develop SQL-based analytics to generate insights on:
Customer Behavior
Product Performance
Sales Trends
These insights empower stakeholders with key business metrics for strategic decision-making.
0
5
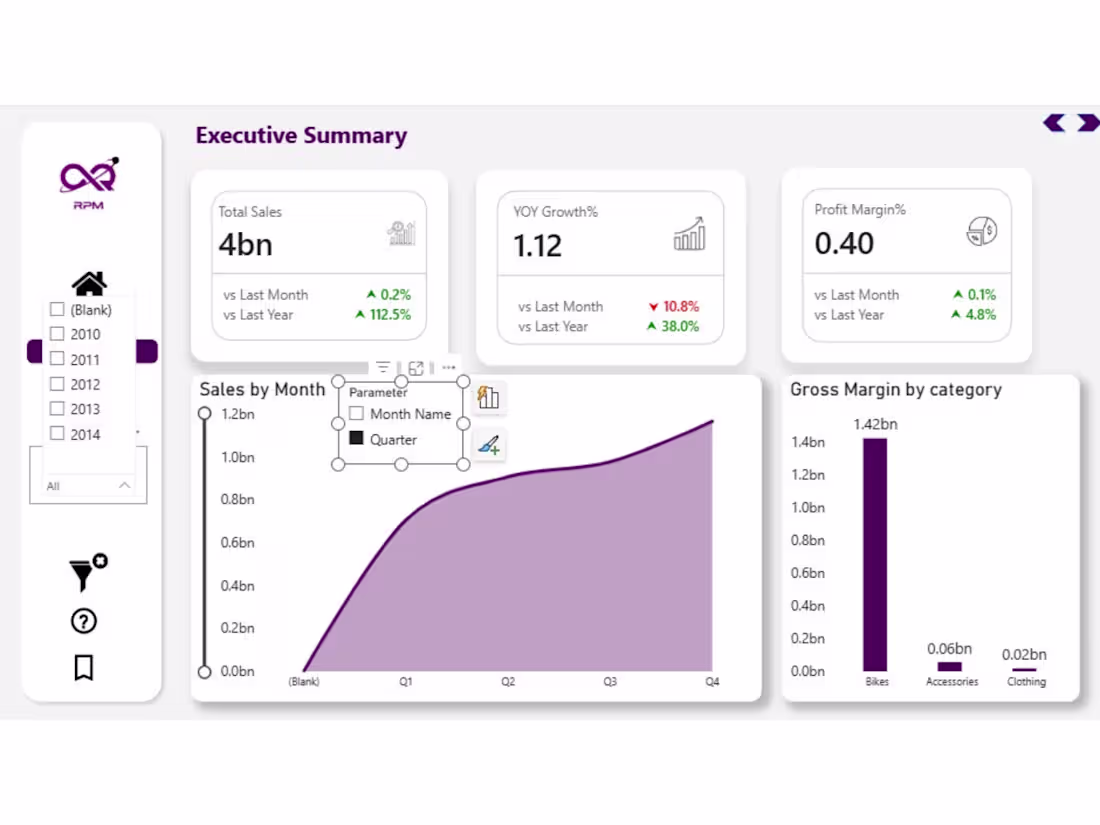
Finance Dashboard Executive Summary.
✅ What This Dashboard Delivers
🔹 360° financial overview
🔹 Deep customer & segment insights
🔹 Product & category profitability
🔹 Region-wise contribution analysis
🔹 Rolling 12-month revenue trends
🔹 Forecasting for future planning
🔹 Cost & operational efficiency KPIs
🔹 Fully interactive filtering and drill-downs
Every KPI, chart, and page has been thoughtfully structured to answer real business questions — not just display numbers.
0
10
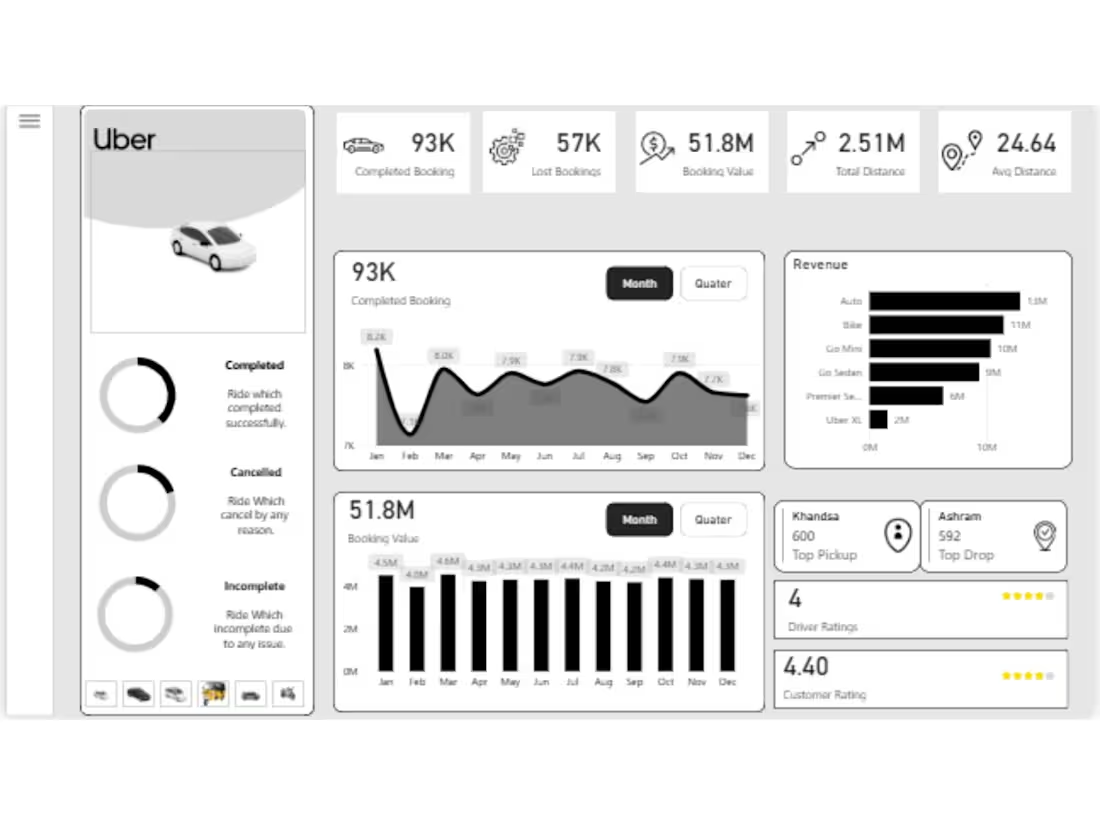
🚗 Uber Dashboard in Power BI – Real-Time Business Insights I will design a fully interactive Uber-style dashboard in Power BI, showcasing key metrics like completed bookings, revenue, booking value, customer ratings, and top locations. This dashboard transforms raw data into actionable insights for smarter decisions. 📊 Pages Included:
Dashboard Overview
Monthly Analytics & KPIs
Booking Status Breakdown
Revenue & Booking Value Charts
Top Pickup/Drop Locations
Driver & Customer Ratings From these 6 pages, you’ll receive: ✔️ Monthly performance trends ✔️ Visual analytics (charts, graphs, maps) ✔️ Booking and cancellation insights ✔️ Location-based ride data ✔️ Customer satisfaction metrics ✔️ Total and average ride distances Built using advanced DAX, Power Query, and clean data modeling, this dashboard is ideal for startups, MSMEs, and enterprises seeking clarity and control over operations. Whether you're pitching to investors, managing ride data, or building your MVP—this dashboard is scalable, professional, and ready to impress. Let’s turn your data into a decision-making powerhouse.
0
18
SaaS Revenue, Growth & Retention Intelligence Dashboard
Enterprise Analytics Architecture & Decision System
Project Overview
This project is an end-to-end analytics system designed to help subscription-based companies answer one core question:
Is our revenue growth durable, predictable, and defensible — or are we masking structural churn with acquisition?
Unlike reporting dashboards that focus on surface-level KPIs, this project is built as a decision-support system for leadership, finance, growth, and retention teams.
It demonstrates how analytics should be structured, validated, and deployed to solve real business risks, not just visualize data.
Business Context & Company Type
This analytics solution is designed for:
SaaS & subscription-based businesses
B2B software companies (Series A → pre-IPO)
Organizations with recurring revenue, churn risk, and customer lifecycle complexity
The dataset represents a company with:
Account-based subscriptions
Multiple billing cycles and plan tiers
Feature usage and behavioral signals
Support tickets impacting churn
Explicit churn events
This mirrors real-world RevOps and Growth Analytics environments.
Core Business Problems Solved
This dashboard addresses four enterprise-critical risks:
False Growth Visibility Separates true revenue growth from churn-offset acquisition.
Revenue Leakage Blindness Identifies where ARR and MRR are lost by plan, customer type, and behavior.
Retention & Churn Misdiagnosis Connects churn outcomes to behavioral and operational signals.
Unpredictable Cash Flow Improves forecasting through billing cycle and subscription intelligence.
Analytics Philosophy
This project strictly follows analytics maturity standards, not ad-hoc dashboarding.
LEVEL 0: MASTER FLOW OVERVIEW
Business Understanding → Data Audit → Data Preparation → Data Modelling → KPI & Metrics → Analysis & Insights → Visualization & Storytelling → Validation → Deployment → Business Adoption
This is the only analytics flow that scales. Everything else is a structured breakdown of this.
LEVEL 1: MASTER FLOWS (Enterprise Analytics Framework)
Each master flow mitigates a specific enterprise risk.
1. Business Understanding & Value Definition
Risk Solved: Analytics without decision impact
Defined executive, finance, growth, and retention use cases
Mapped KPIs directly to leadership decisions
Explicitly rejected vanity metrics
Outcome: Analytics exists to drive action, not reporting.
2. Data Audit & Feasibility Assessment
Risk Solved: Unreliable or misleading insights
Assessed raw datasets for:
Grain consistency
Missing identifiers
Temporal limitations
Identified proxy metrics vs factual metrics
Flagged analytical constraints early
Outcome: No false confidence from weak data.
3. Data Preparation & Transformation
Risk Solved: Inconsistent definitions across teams
Cleaned and standardized subscription, account, churn, usage, and support data
Normalized date logic using a dedicated Date dimension
Created analysis-ready structures without altering raw facts
Outcome: Stable foundation for scalable analytics.
4. Analytical Data Modelling
Risk Solved: Performance bottlenecks and ambiguous logic
Star-schema–oriented analytical model
Clear separation of:
Fact tables (Subscriptions, Churn, Usage, Tickets)
Dimension tables (Account, Date, Plan, Feature)
Relationships designed for analytical clarity, not convenience
Outcome: High-performance, explainable model.
5. KPI, Metrics & Business Logic Layer
Risk Solved: Multiple versions of truth
Defined metrics at business meaning level:
ARR, MRR, Net Revenue Growth
Logo Churn vs Revenue Churn
Activation and retention proxies
Explicitly documented assumptions where proxies are used
Ensured consistent filters across all pages
Outcome: One version of truth for leadership.
6. Exploratory Analysis & Insight Discovery
Risk Solved: Reactive decision-making
Identified:
Revenue concentration risks
Retention decay patterns
Plan-level churn exposure
Tested behavioral correlations with churn and retention
Outcome: Early warning signals instead of post-mortems.
7. Visualization & Dashboard Engineering
Risk Solved: Dashboards that don’t get used
Dashboards are structured by decision ownership, not data domains.
Page 1: Executive Overview
30-second business health check for CEOs and founders.
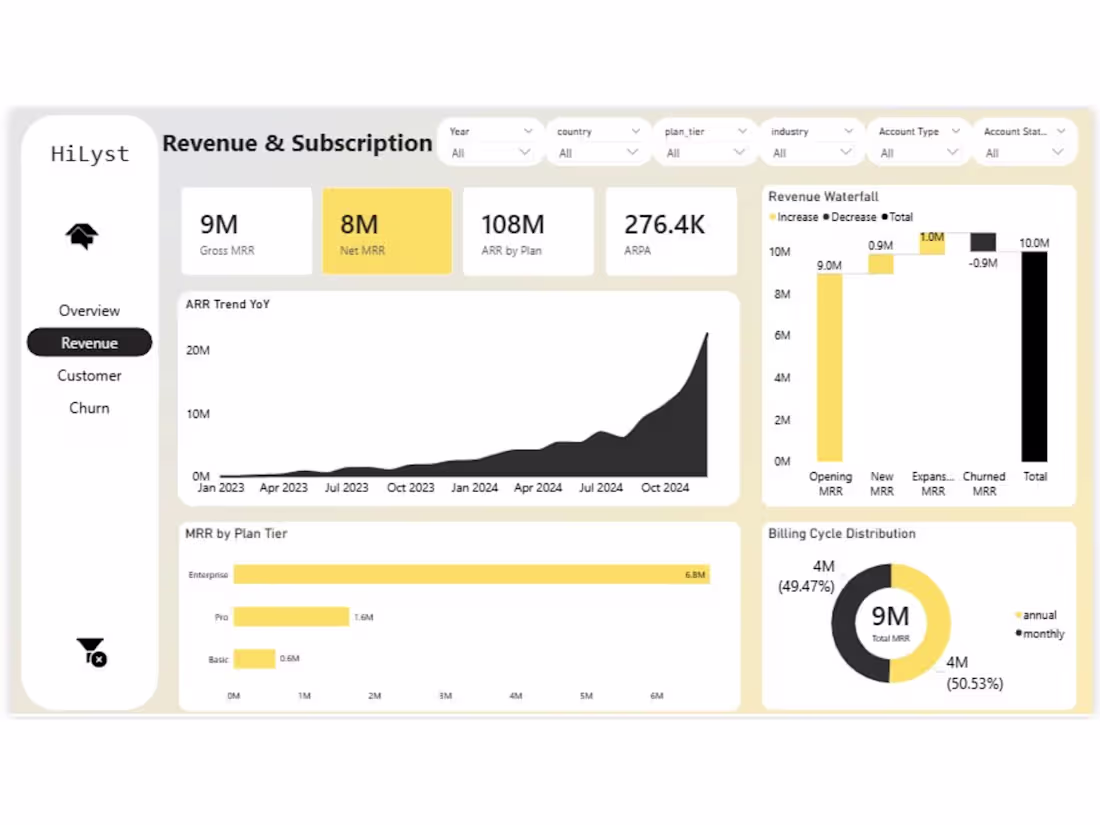
Page 2: Revenue & Subscription Intelligence
Finance-grade revenue quality, billing mix, and predictability.
Page 3: Customer Growth & Cohort Analysis
Growth efficiency and long-term value assessment.
Page 4: Churn & Retention Intelligence
Root-cause analysis for customer and revenue loss.
Outcome: Each page answers a clear business question.
8. Validation, Governance & Quality Control
Risk Solved: Loss of trust in numbers
Reconciled KPIs across pages
Identified mismatches and weak metrics
Highlighted where data limits interpretation
Outcome: Transparent, auditable analytics.
9. Deployment, Access & Enablement
Risk Solved: Analytics unused after delivery
Designed for:
Executive consumption
Finance review
Growth and retention teams
Clear filtering logic and drill paths
Outcome: Analytics integrated into decision workflows.
10. Business Adoption & Continuous Improvement
Risk Solved: One-time dashboard projects
Metrics designed to evolve with better data
Structure supports future enrichment:
Sales data
Marketing attribution
Product telemetry
Outcome: Long-term analytics asset, not a static report.
Fortune 500 Readiness Assessment (Honest)
Design maturity: High
Business framing: Strong
Analytical rigor: Medium (data-limited, transparently flagged)
Production readiness: Requires tighter metric reconciliation
This project is not presented as production finance reporting. It is positioned correctly as a Revenue & Growth Intelligence Framework.
Why This Project Matters
Most dashboards answer:
“What happened?”
This system answers:
“Why it happened, where risk exists, and what breaks next if nothing changes.”
That is the difference between reporting and analytics leadership.
Author
Himansh Upadhyay Analytics | Business Intelligence | Decision Systems
This project reflects an analytics mindset focused on profitability, risk reduction, and executive decision-making, not tool usage.
0
16