
Harshil Trivedi
Building dashboards that turn data into decisions
New to Contra
Harshil is ready for their next project!
I designed and developed a Spotify-inspired Music Analytics Dashboard in Microsoft Power BI, combining data modelling, DAX, interactive navigation, and custom dashboard design into a single analytical experience.
The dashboard allows users to explore music data from different perspectives — from overall performance and popularity to individual artists, songs, albums, and trends over time.
What I built
- Overview Dashboard — high-level KPIs and music performance trends
- Artist Analytics — artist rankings, song counts, popularity and catalogue analysis
- Song Analytics — song popularity, duration, year-wise analysis and album insights
- Interactive Navigation — seamless movement between dashboard sections
- Dynamic Visual Analysis — monthly trends, popularity patterns and category comparisons
- Detailed Data Tables — deeper exploration beyond summary-level KPIs
- Spotify-inspired UI — dark, modern interface designed around the visual identity of a music streaming platform
Key metrics explored
- 342 Artists
- 789 Distinct Songs
- 562 Albums
- Average Song Duration: 3.28 minutes
- Average Popularity: 90
Tools & Skills
Power BI · DAX · Data Modeling · Data Visualization · Interactive Dashboard Design · KPI Development · Business Intelligence
The goal wasn't simply to create another Power BI report — it was to make the data explorable, intuitive and visually engaging.
Interested in turning your own data into an interactive Power BI dashboard? Let's connect.
1
48
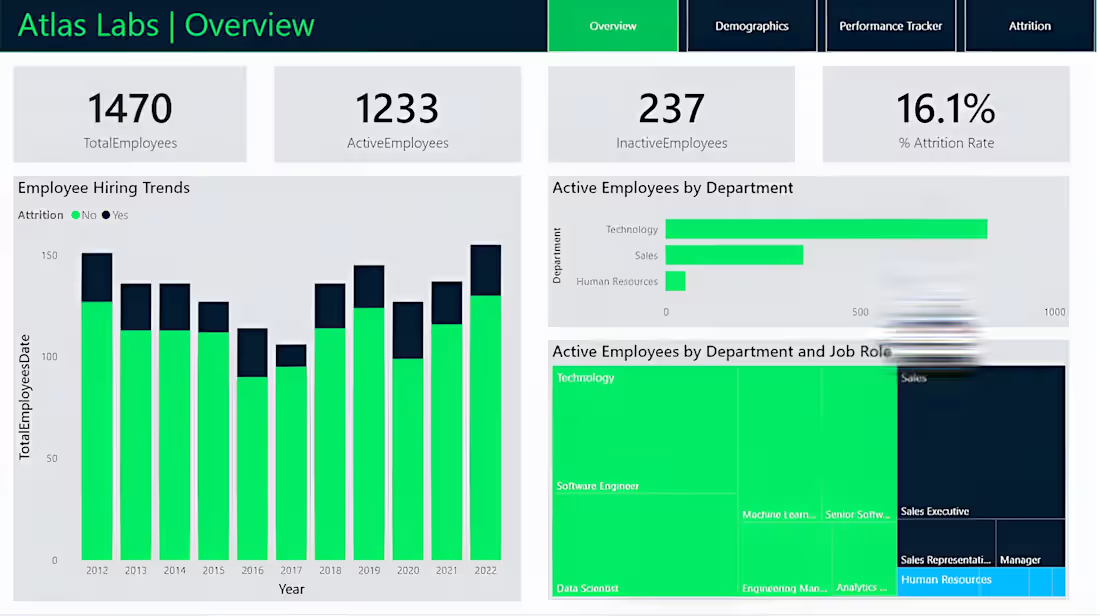
Workforce Performance Intelligence Platform
0
0
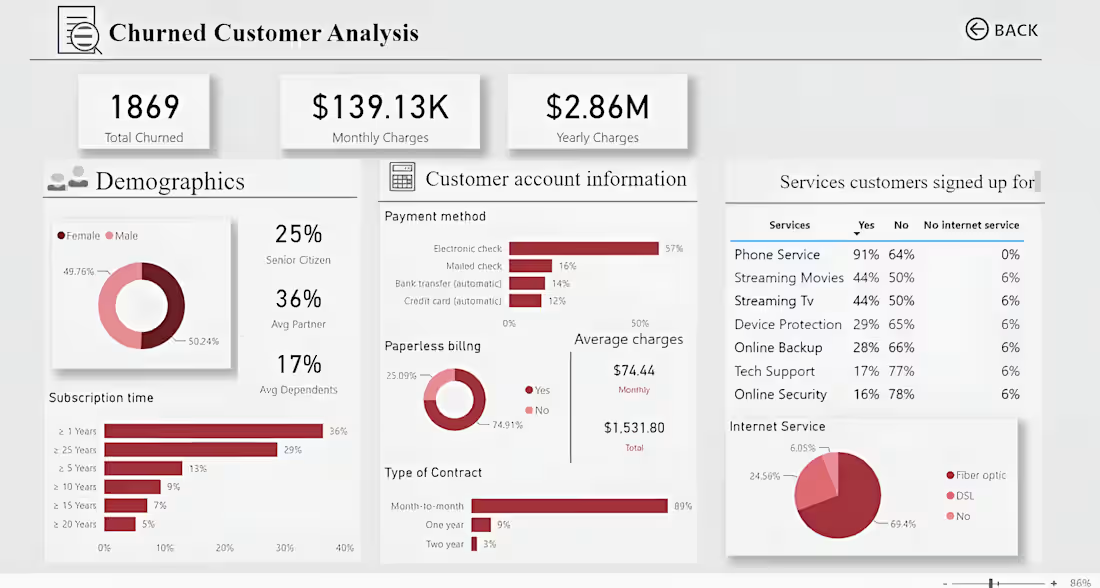
Telecom Customer Retention Intelligence
0
4
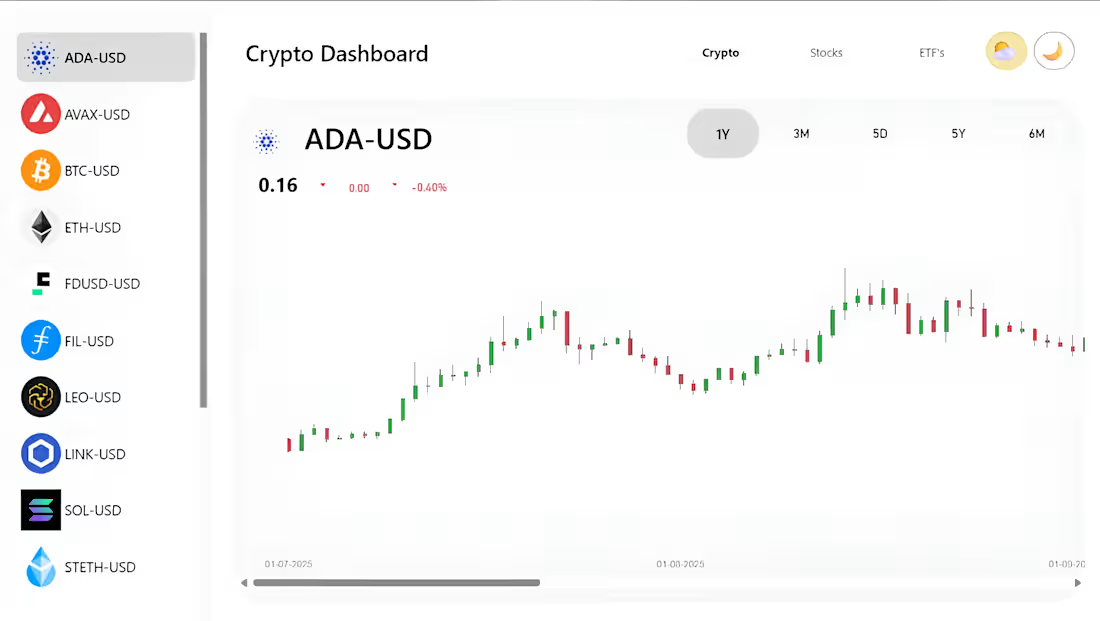
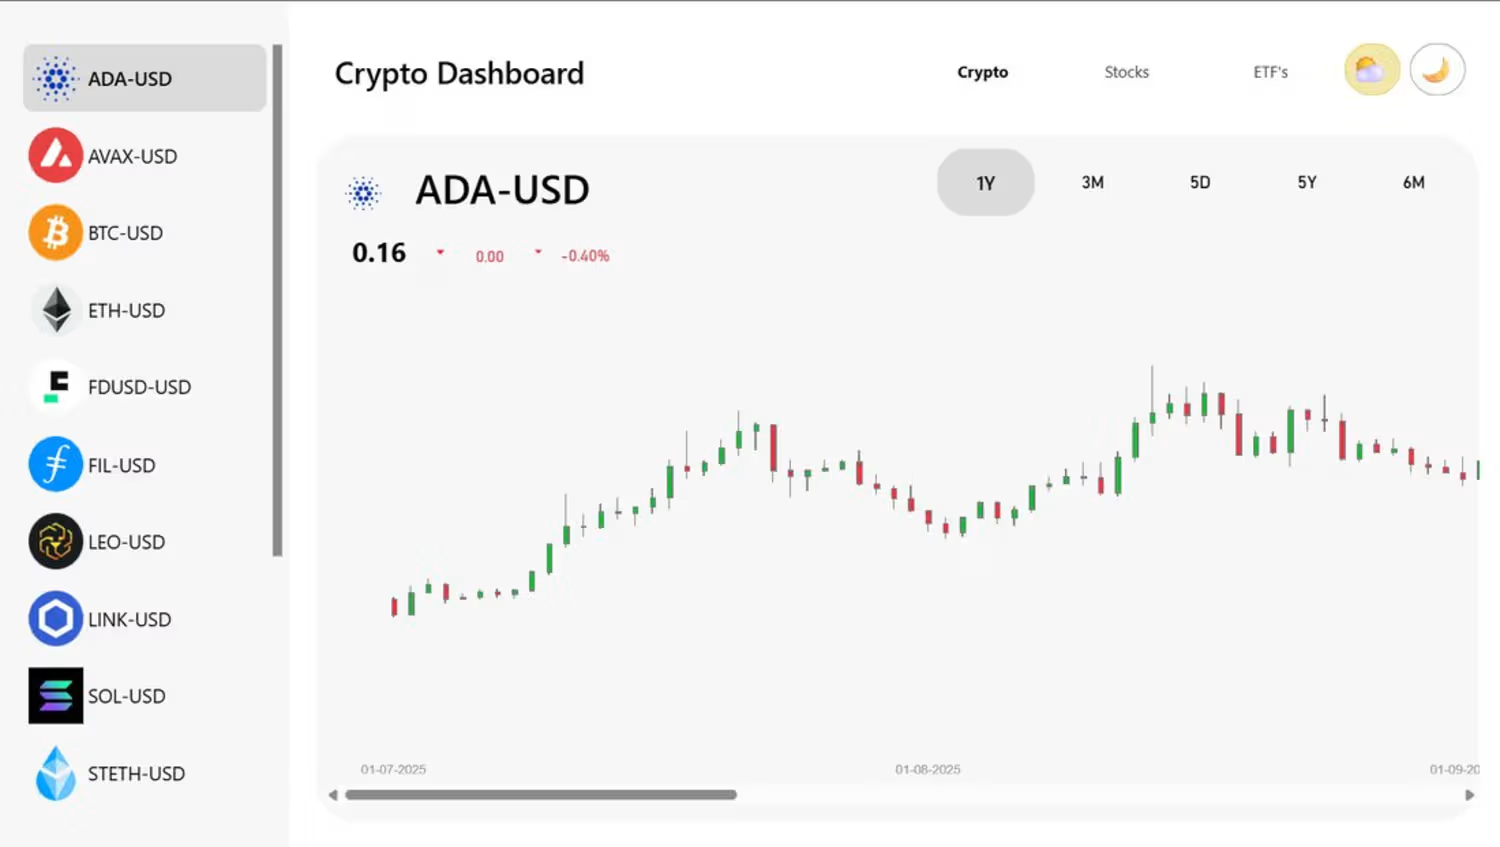
Multi-Asset Market Intelligence Suite
0
3