
Gohar Fatima
Power BI Data Analyst & SEO Specialist | Dashboard + Ranking
New to Contra
Gohar is building their profile!
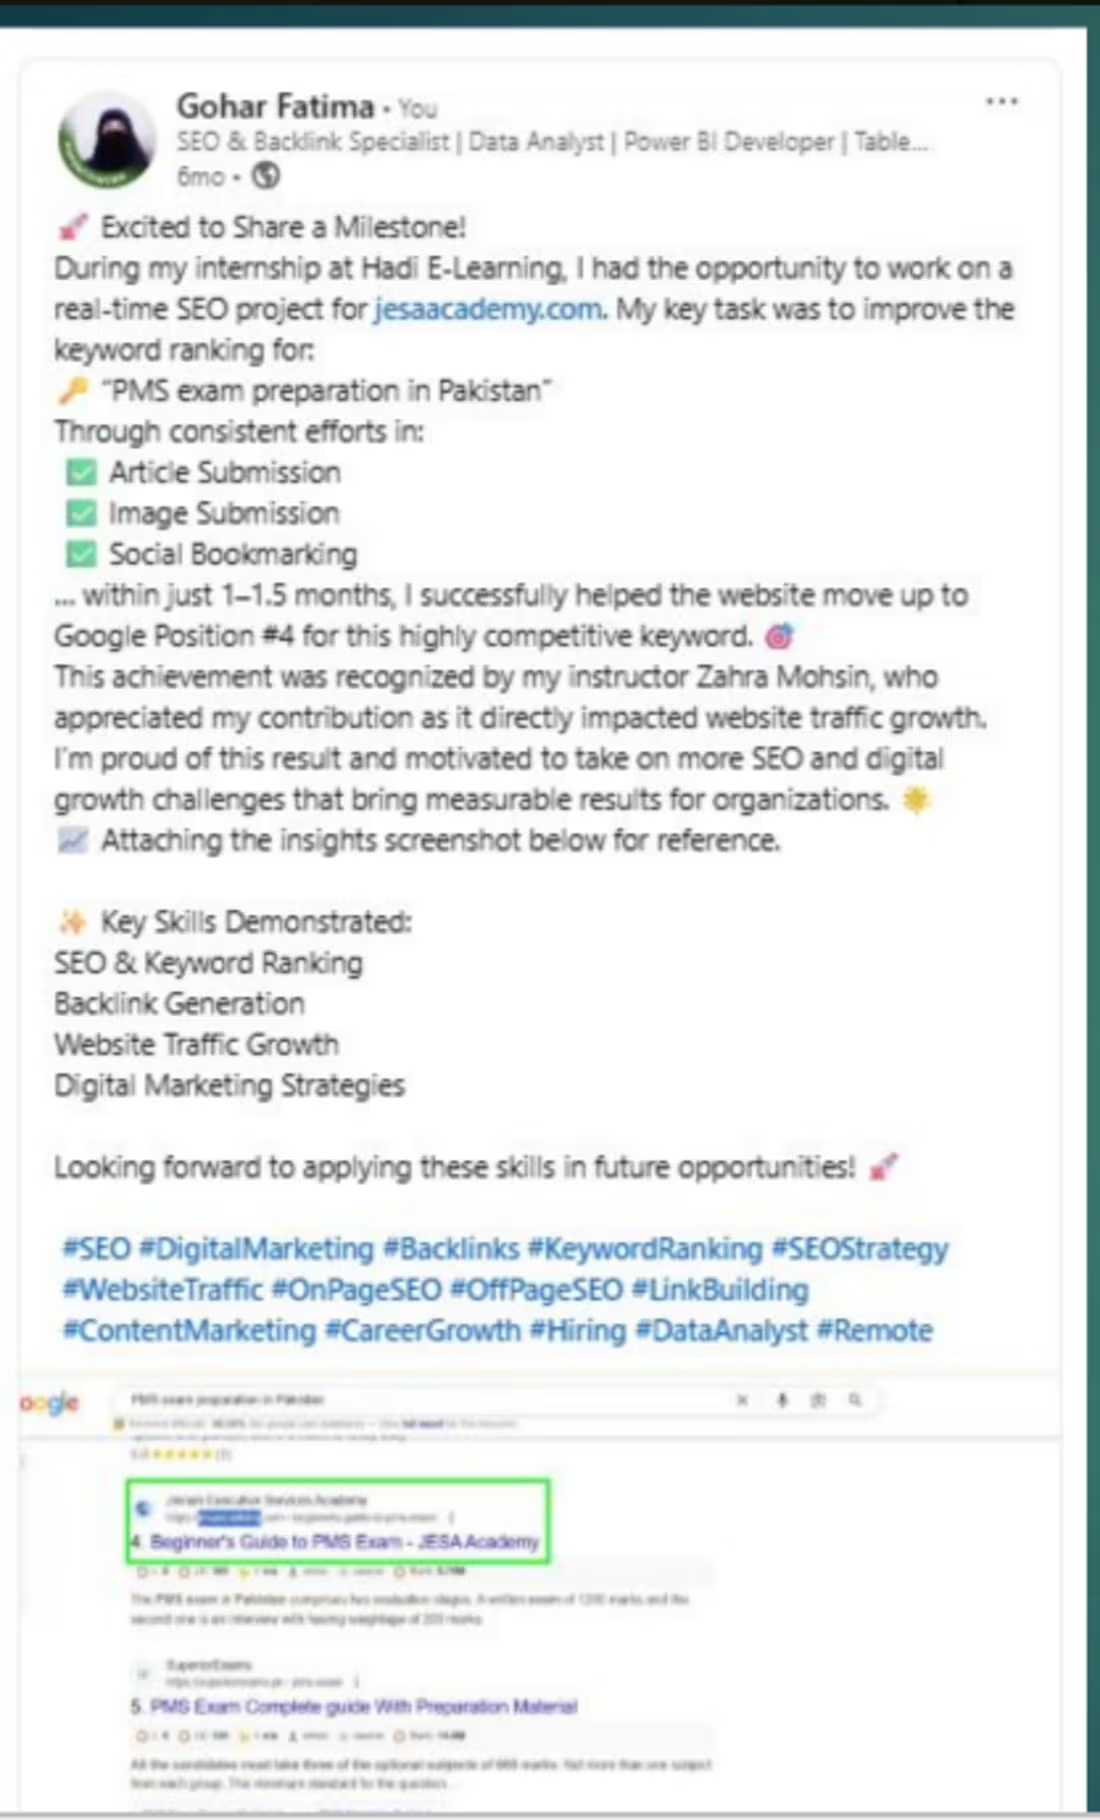
SEO Link Building — Improved Education Platform Keyword Ranking (Rank 7 to 4)
Business Problem: An education platform needed better Google visibility for a competitive exam-preparation keyword in Pakistan.
Tools Used: Off-Page SEO, Article Submissions, Social Bookmarking, Pinterest, Medium
KPIs Tracked: Keyword Ranking Position, Time to Result, Backlinks Generated
Insights Discovered:
• Ranking Improvement: "PMS exam preparation in Pakistan" moved from rank 7 to rank 4
• Fast Results: Achieved within 1-1.5 months of consistent SEO work
• Method: Article submissions, image submissions, and social bookmarking across Pinterest, Medium, and Tumblr
#SEO #LinkBuilding #OffPageSEO #KeywordRanking #GoogleRanking #EducationMarketing #BacklinkBuilding #DigitalMarketing #SEOSpecialist #WhiteHatSEO
0
3
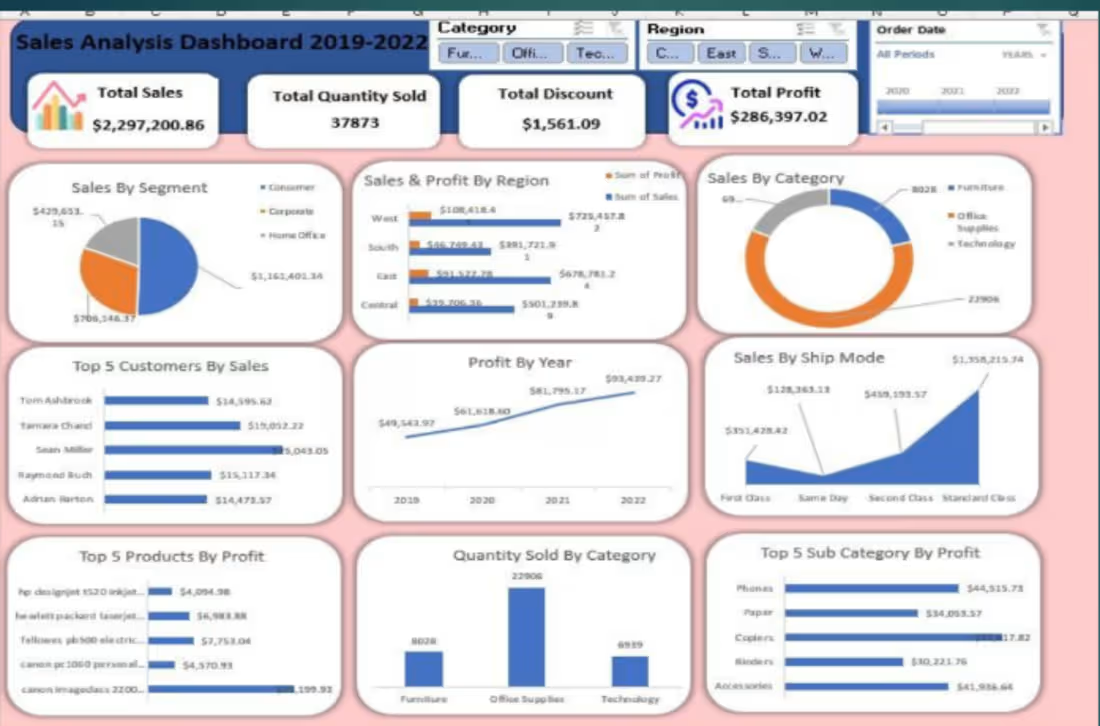
Excel Dashboard — Sales Analysis & Profit Tracking
Business Problem: A business owner needed a self-updating sales report to replace hours of manual monthly reporting.
Tools Used: Microsoft Excel, Pivot Tables, Data Visualization
KPIs Tracked: Total Sales ($2.29M), Total Profit ($286K), Units Sold (37,873)
Insights Discovered:
• Top Customers: Top 5 customers by sales identified for account management priority
• Product Performance: Top 5 products by profit revealed inventory focus areas
• Regional Trends: Sales by region and segment breakdown supported strategic planning
#Excel #MicrosoftExcel #DataAnalyst #SalesAnalysis #ExcelDashboard #BusinessIntelligence #DataVisualization #PivotTables #RemoteWork #DashboardDevelopment
1
8
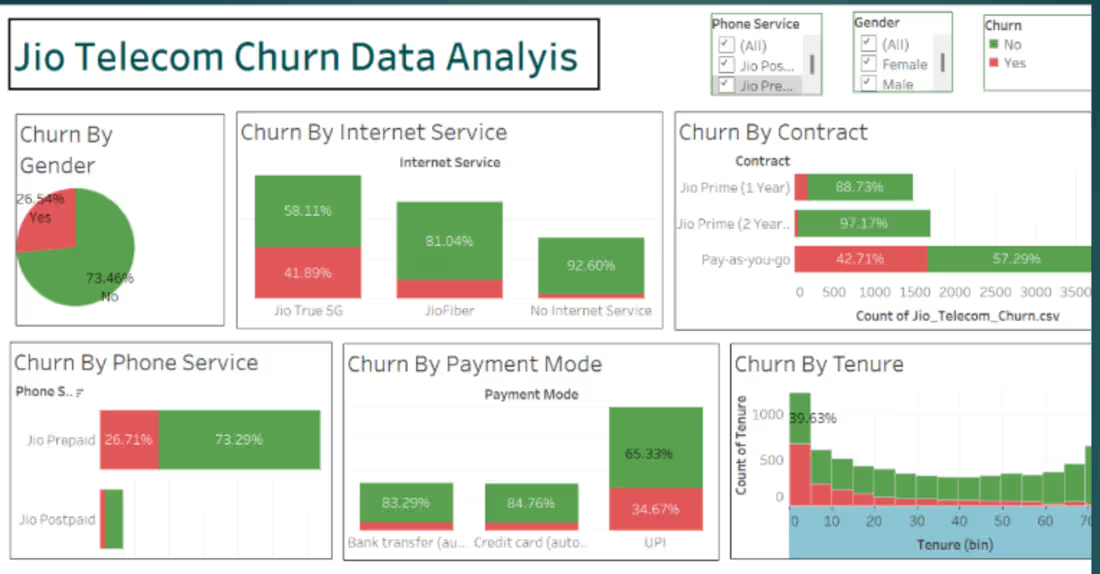
Tableau Telecom Dashboard — Customer Churn Analysis & Retention Insights
Business Problem: A telecom company needed to identify which customer segments were at highest risk of churning.
Tools Used: Tableau, Data Analysis
KPIs Tracked: Churn Rate by Contract Type, Churn by Payment Mode, Customer Tenure
Insights Discovered:
• Contract Risk: Pay-as-you-go contracts showed 57% churn vs only 3% on 2-year contracts
• Secondary Improvement: Payment mode strongly correlated with churn likelihood
• Tenure Impact: Customer tenure analysis revealed critical retention windows
#Tableau #DataAnalyst #ChurnAnalysis #CustomerRetention #TelecomAnalytics #BusinessIntelligence #DataVisualization #KPIDashboard #RetentionStrategy #RemoteWork
1
11
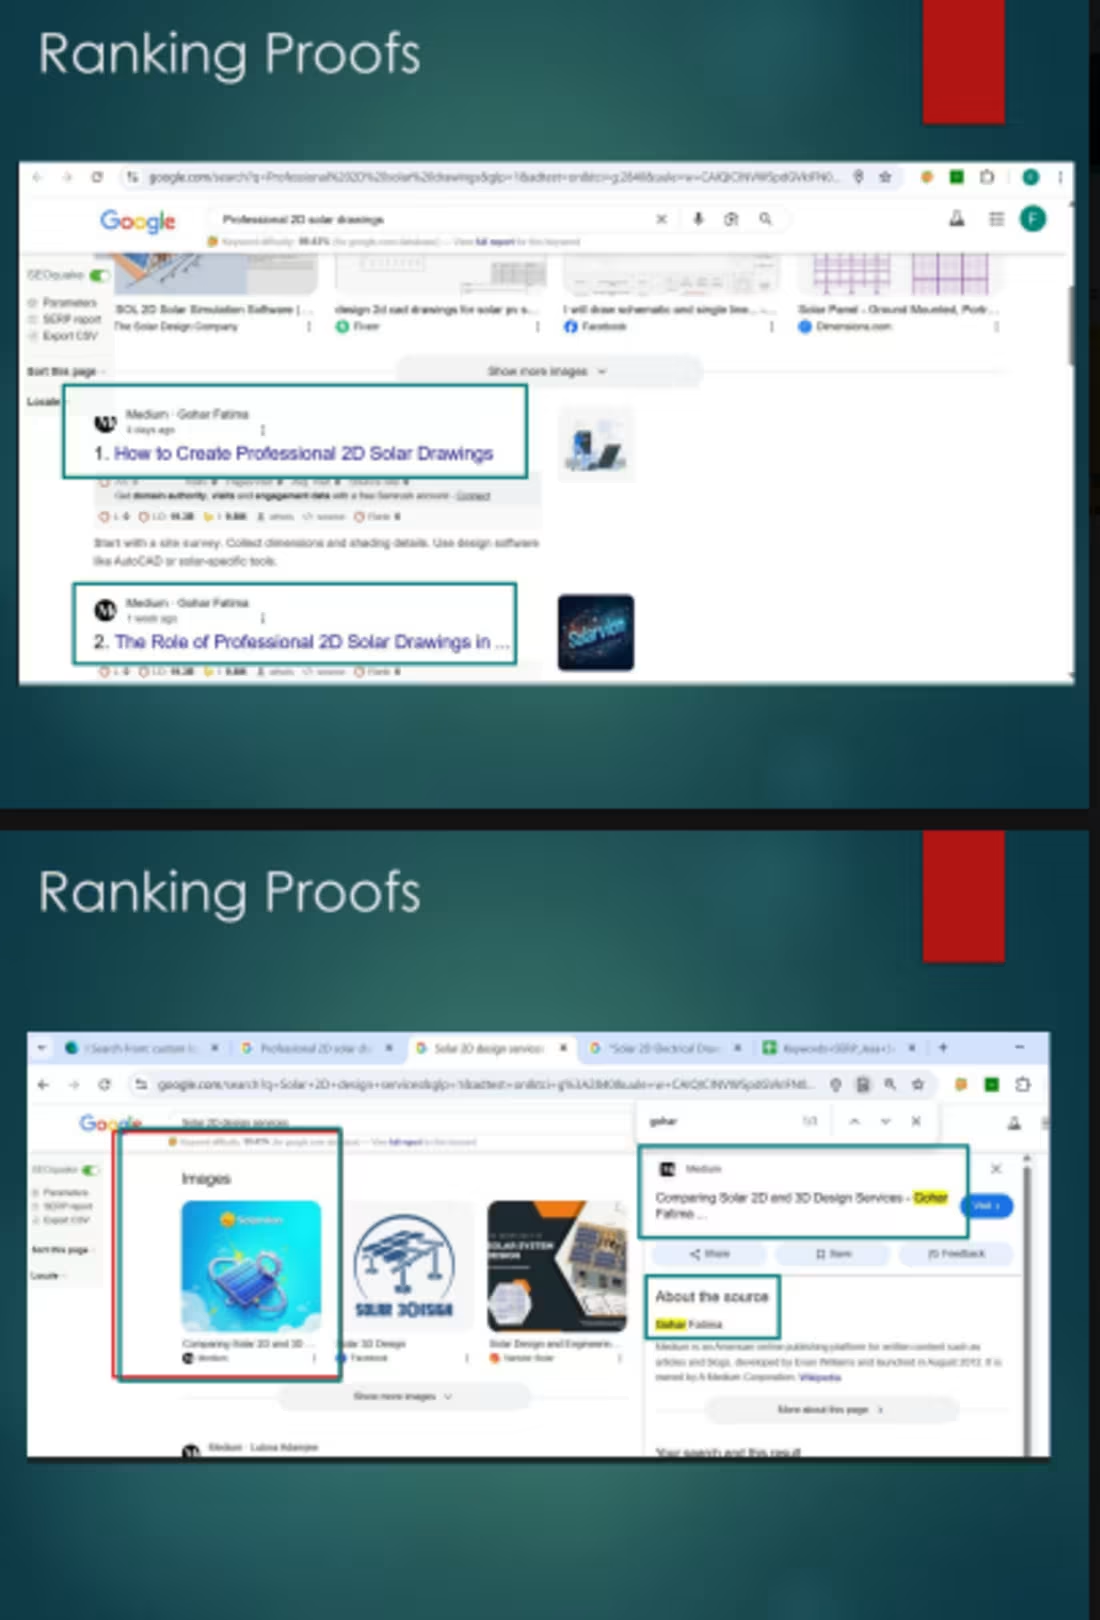
SEO Link Building — Ranked Solar Company Keyword #1 on Google USA
Business Problem: A US-based solar company needed to improve organic search visibility for high-competition industry keywords.
Tools Used: Off-Page SEO, Backlink Building, Medium, Pinterest
KPIs Tracked: Keyword Ranking Position, Backlinks Generated, Organic Visibility
Insights Discovered:
• Top Ranking Achieved: "Solar 2D Electrical Drawings in USA" reached Google position #1
• Secondary Improvement: "Solar 2D design services" improved from rank 22 to 10
• Method: Backlink generation, article submissions, and image submissions across high-authority platforms
#SEO #LinkBuilding #OffPageSEO #BacklinkBuilding #GoogleRanking #KeywordRanking #SEOSpecialist #DigitalMarketing #WhiteHatSEO #SEOResults
0
24
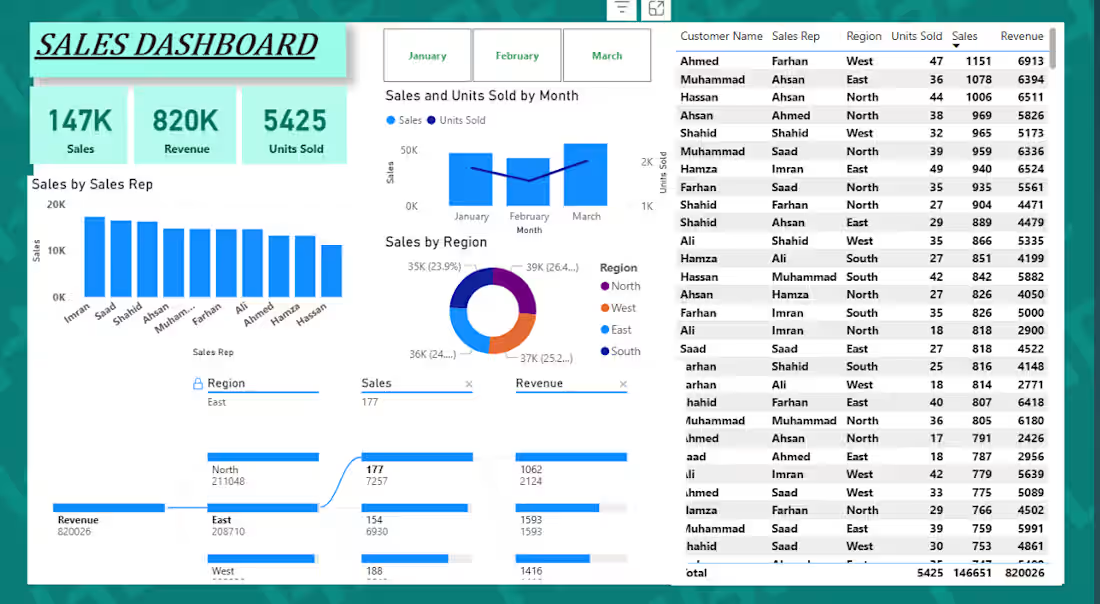
Power BI Sales Dashboard — Regional Revenue & Performance Tracking
Business Problem: Sales leadership needed visibility into regional performance and sales representative productivity.
Tools Used: Power BI, DAX
KPIs Tracked: Total Sales (820K), Total Revenue (147K), Units Sold (5,425)
Insights Discovered:
• Regional Performance: Identified top and bottom performing regions across North, South, East, West
• Rep Productivity: Sales rep performance comparison enabled targeted coaching
• Customer Insights: Customer-level detail table supported account management decisions
#PowerBI #DataAnalyst #SalesDashboard #BusinessIntelligence #DataVisualization #KPIDashboard #PowerBIDeveloper #SalesAnalytics #RemoteWork #DashboardDevelopment
0
27
Power BI Hospitality Dashboard — 11-Page Hotel & Booking Business Intelligence Report
Business Problem: A travel and tourism client needed a centralized system to track bookings, payments, hotel performance, and supplier relationships across multiple properties.
Tools Used: Power BI, DAX, Power Query
KPIs Tracked: Total Sales ($365K), Total Profit ($165K), Profit Margin (45.2%), Total Bookings, Hotel Performance by Agent
Insights Discovered:
• Profitability: Achieved 45.2% profit margin across all hotel operations
• Operational Scope: 11 interactive pages covering Bookings, Payments, Transport, and Meal Services
• Supplier Analysis: Supplier vs Client comparison enabled cost optimization
1
113
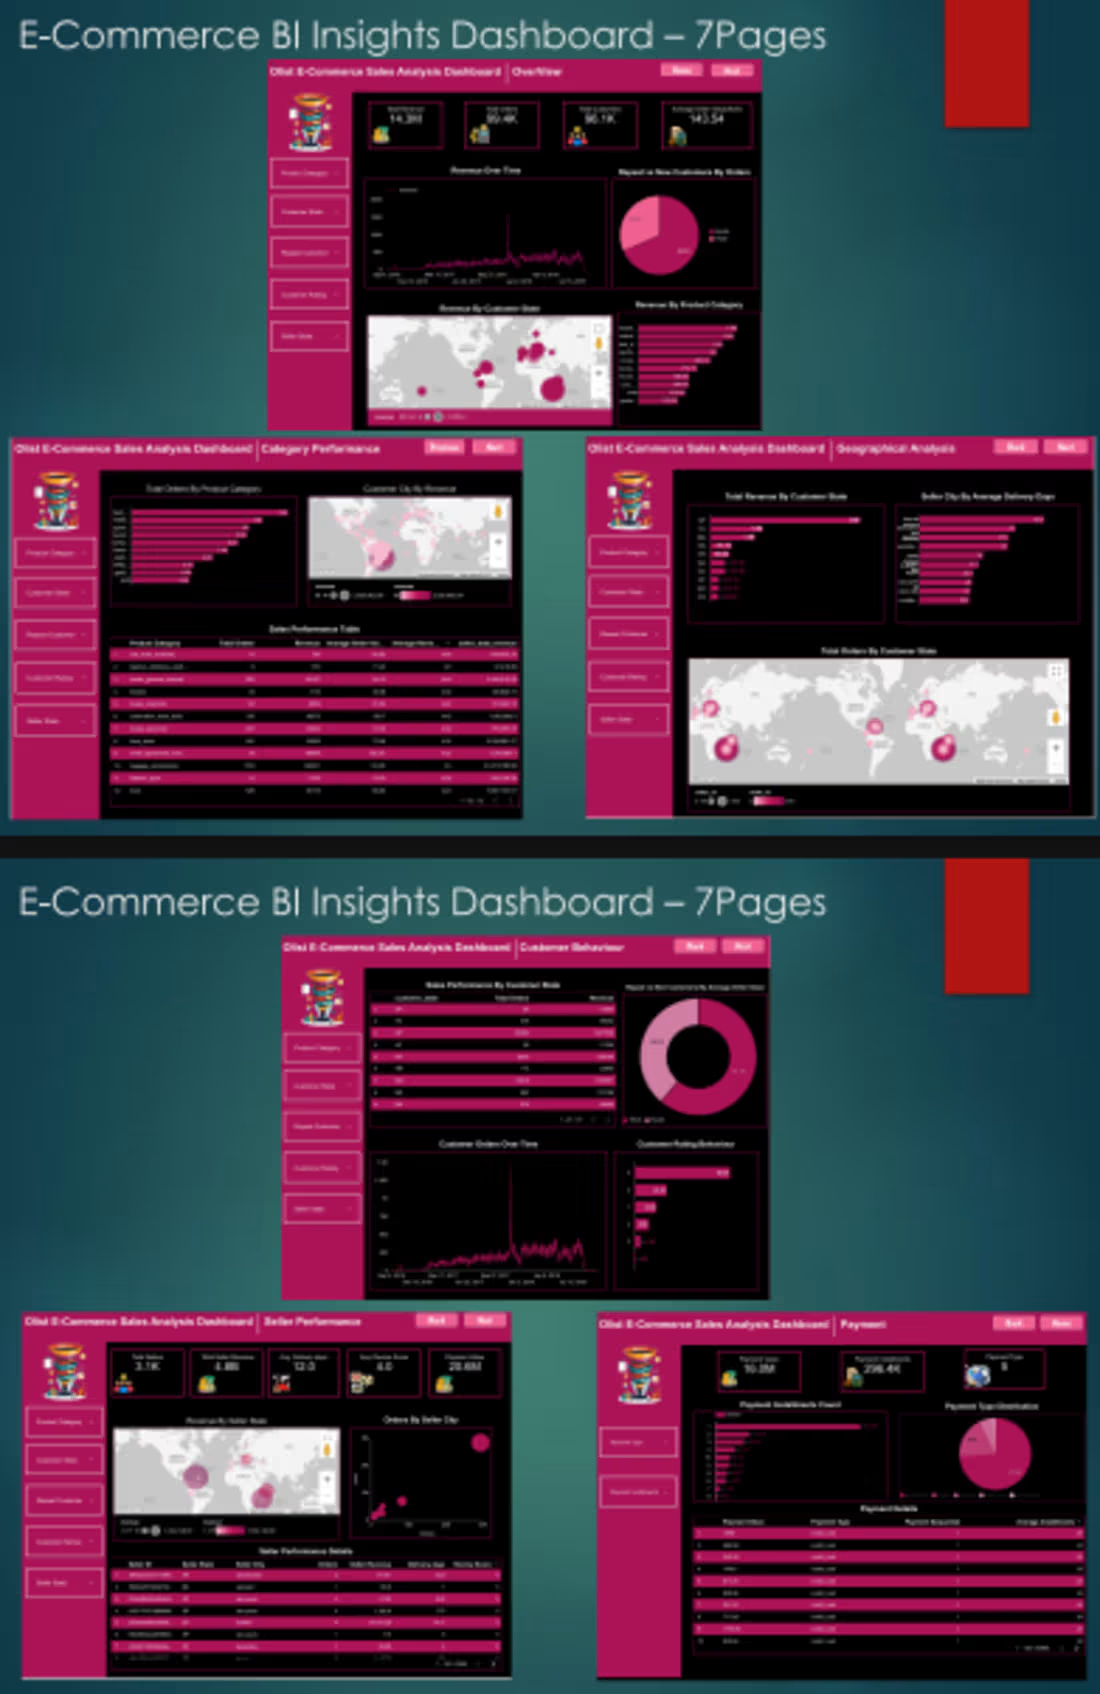
Looker Studio E-Commerce Dashboard — 7-Page Sales Analytics Report
0
50
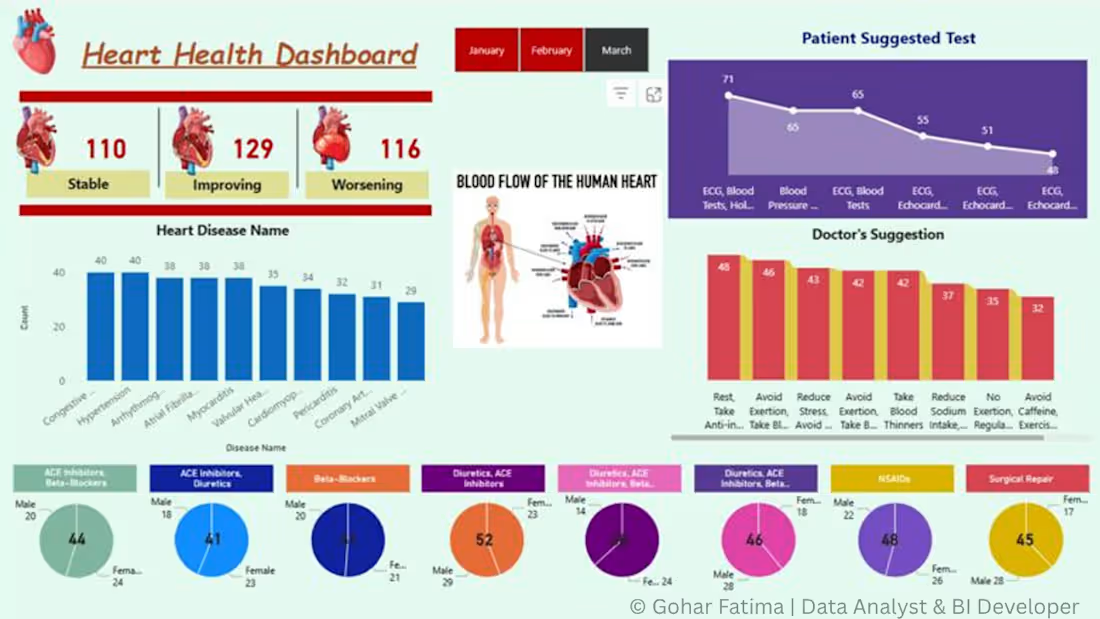
Power BI Heart Health Dashboard - Health Care KPI Analysis
0
86
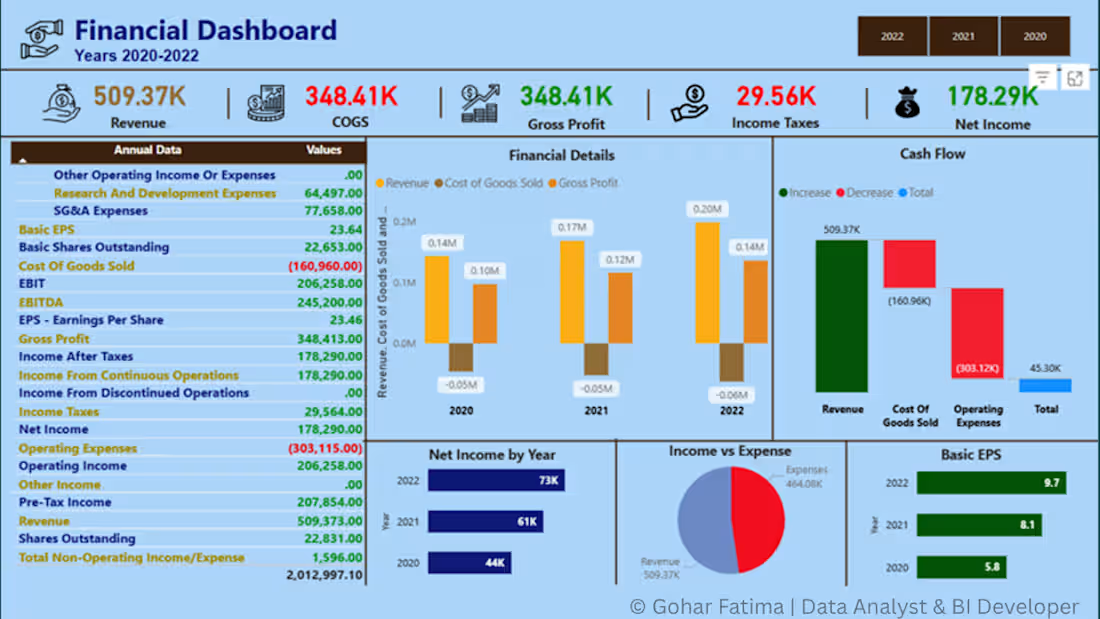
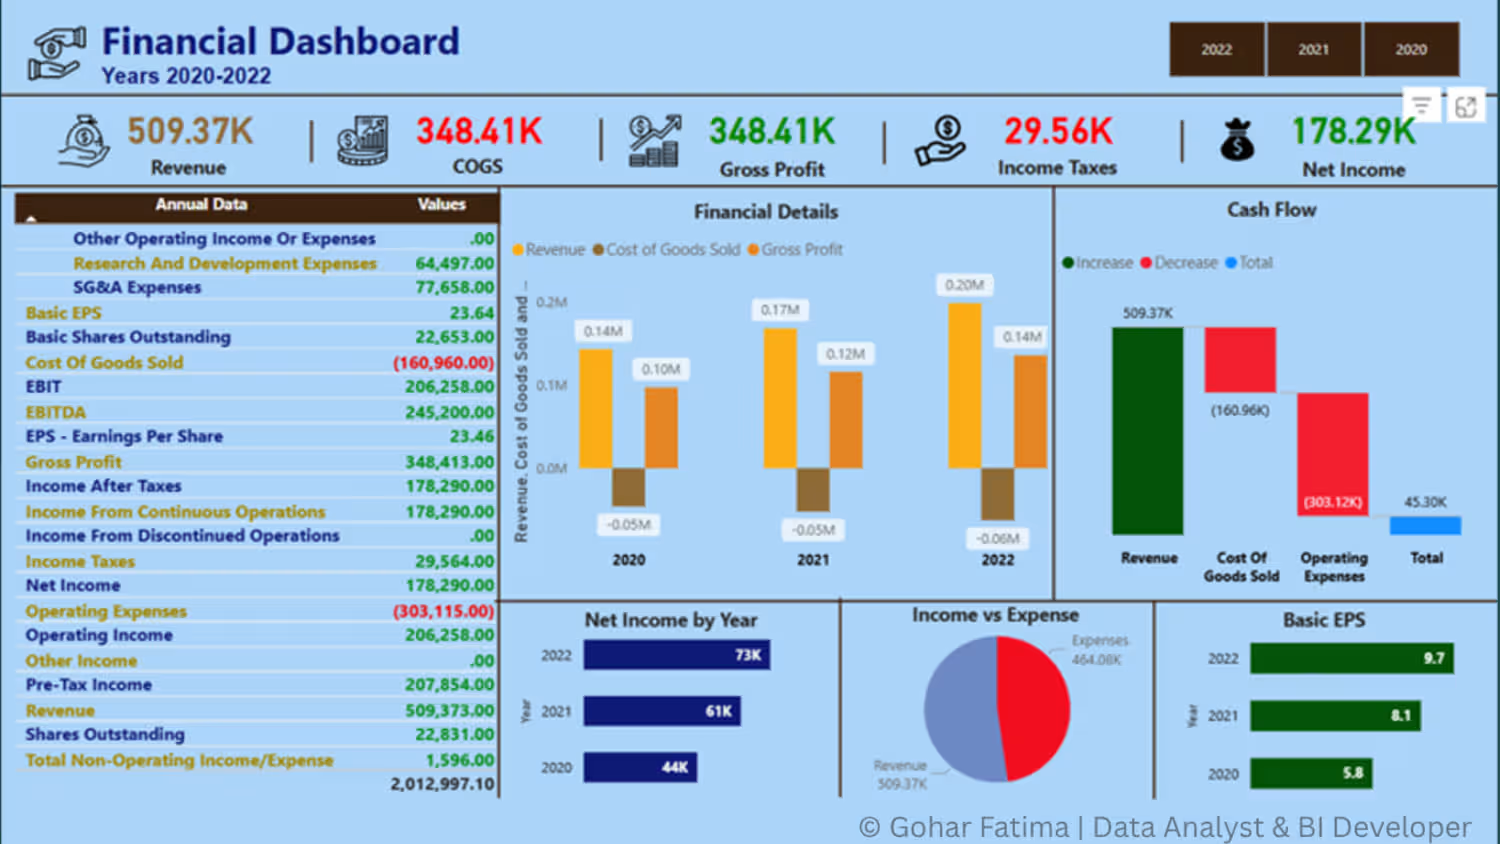
:Power BI Financial Dashboard _Revenue, Profit & KPI Analysis
0
100