
Gbadebo Hameed
Data Analyst & Accountant | Excel & Power BI Expert
New to Contra
Gbadebo is ready for their next project!

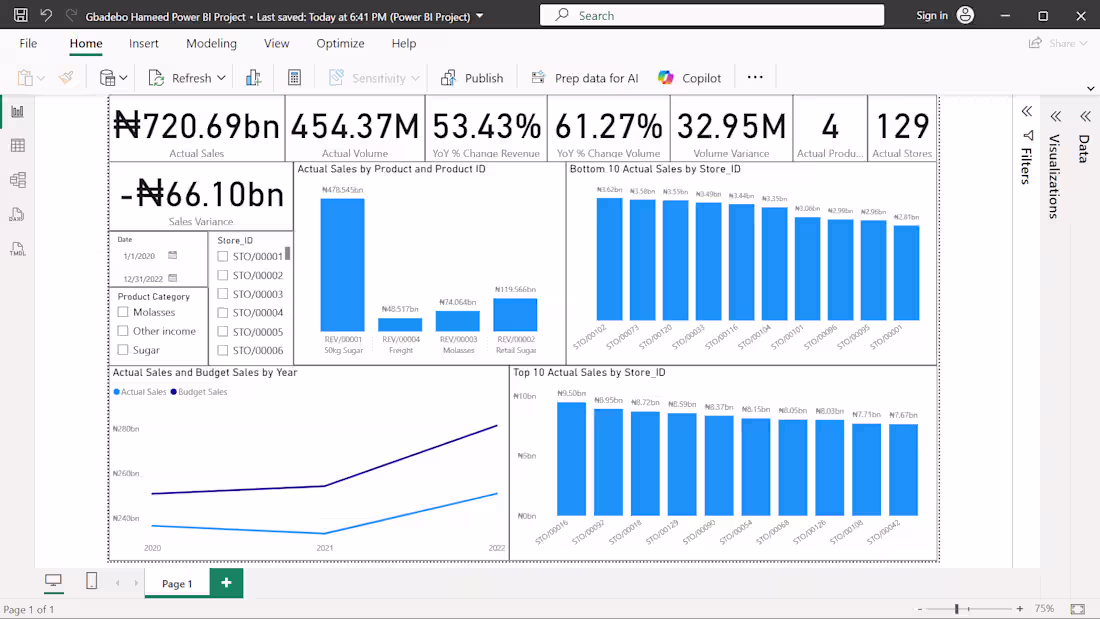
Based on the dashboard , the Power BI project delivers a comprehensive analysis of commercial operations, tracking a total of ₦720.69 billion in Actual Sales across 129 actual stores and 4 distinct product categories. While top-line growth is robust—highlighted by a 53.43% YoY increase in revenue and a 61.27% YoY surge in actual volume (reaching 454.37 million units)—the business faced a challenging budget gap, resulting in a negative sales variance of -₦66.10 billion.
0
14
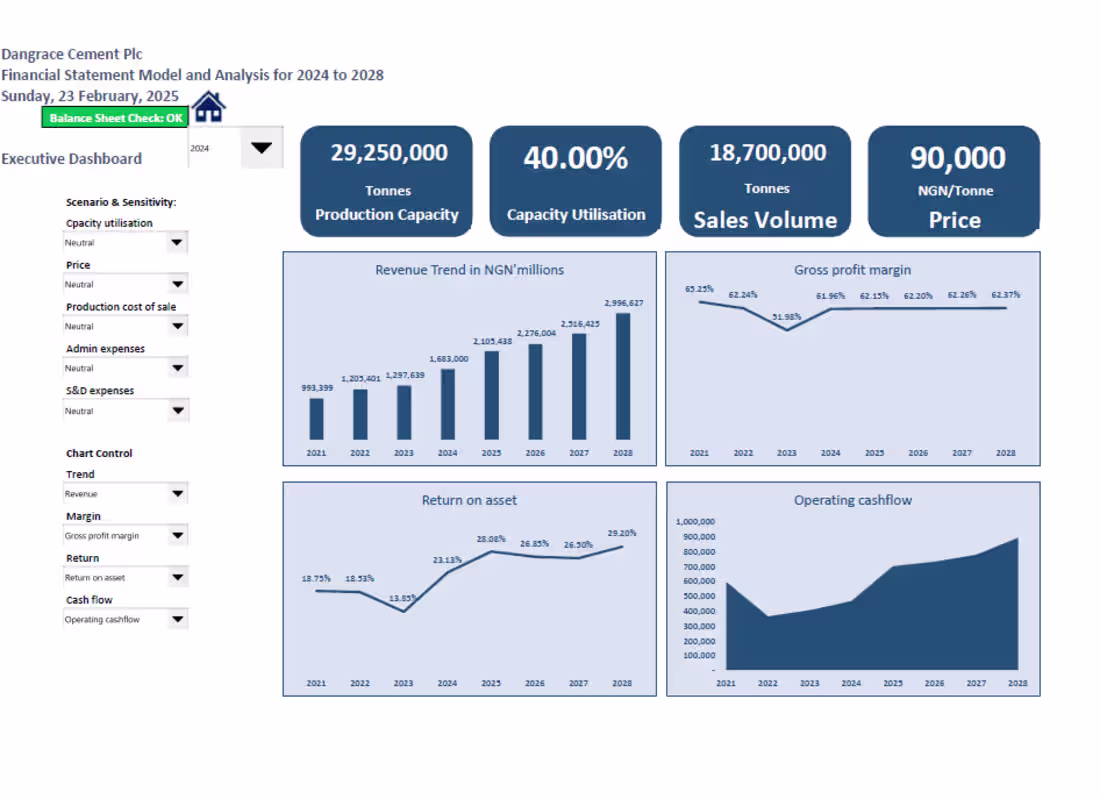
The financial statement model for Dangrace Cement Plc presents a comprehensive five-year forecast from 2024 to 2028, showing strong revenue scaling alongside tightly controlled cost structures. Revenue is projected to expand significantly, rising from NGN 1.68 trillion in the 2023 historical baseline to NGN 2.997 trillion by 2028. This growth is primarily supported by stable gross profit margins hovering around 62% throughout the forecast period, driven by an optimized production cost of sales fixed at 37% of revenue across all projection years.
0
22
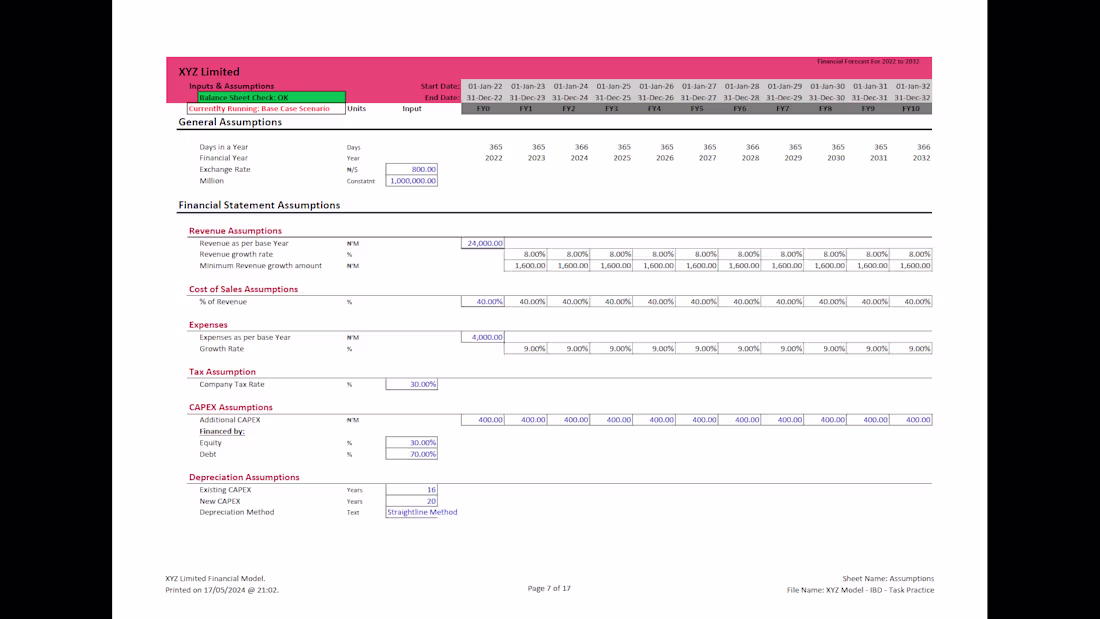
The model is essentially a fully integrated 10-year three-statement financial model that links the Income Statement, Balance Sheet, and Cash Flow Statement dynamically, meaning any operational shift automatically updates the entire ecosystem. It handles forecasting by anchoring line items to fixed percentage drivers, such as setting accounts receivable to 20% of revenue and inventory to 25% of the cost of sales to maintain structured working capital cycles. Structurally, it separates capital management into an aggressive repayment schedule for legacy debt and a continuous financing loop where 70% of annual CAPEX is funded via new debt. Finally, it layered in a scenario manager to stress-test these mechanics across Base, Best, and Worst-case outcomes, while feeding a Dupont analysis matrix to track true return on equity performance.
0
26
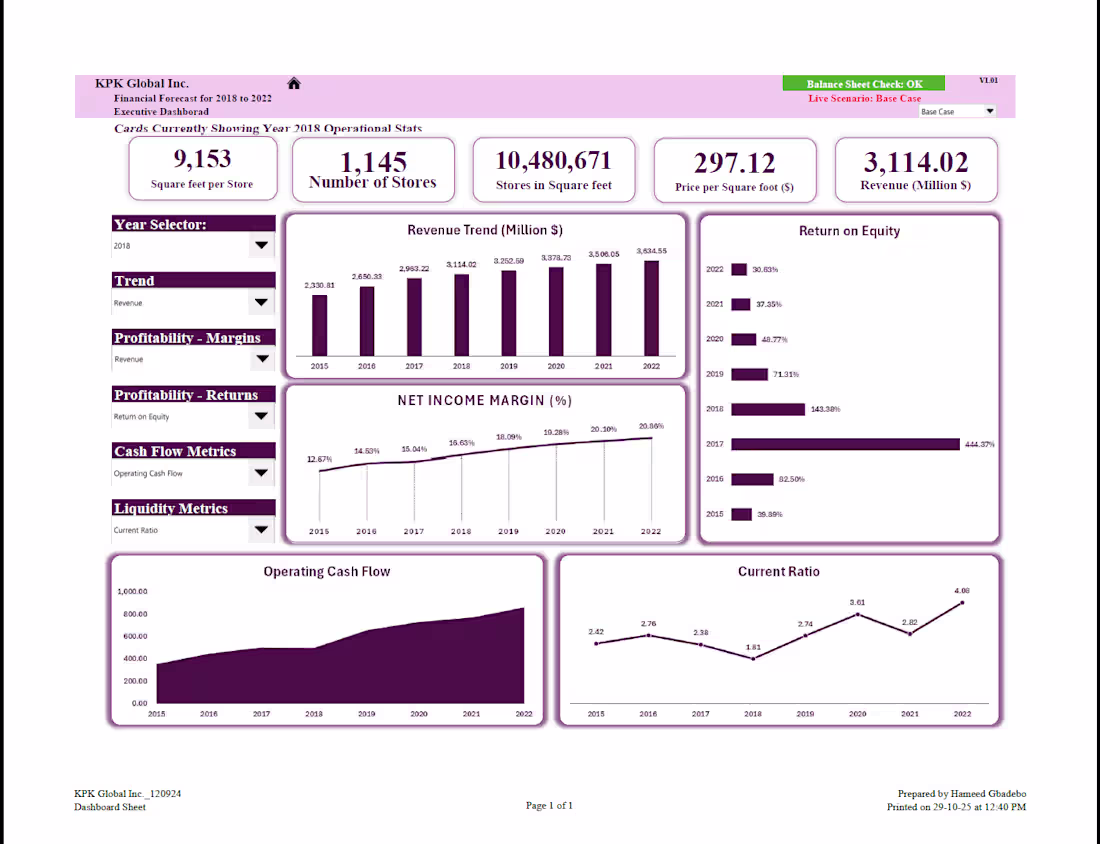
Designed and developed a dynamic, fully interactive Executive Financial Dashboard for KPK Global Inc. to track historical performance (2015–2017) and project financial trajectories over a 5-year forecast period (2018–2022). The model acts as a single source of truth for executives, translating complex 3-statement financial models into scannable, actionable visual insights.
0
35