
Ganesh Singh
Power BI | SQL | Excel Data Analyst | Dashboard & Insights
New to Contra
Ganesh is ready for their next project!

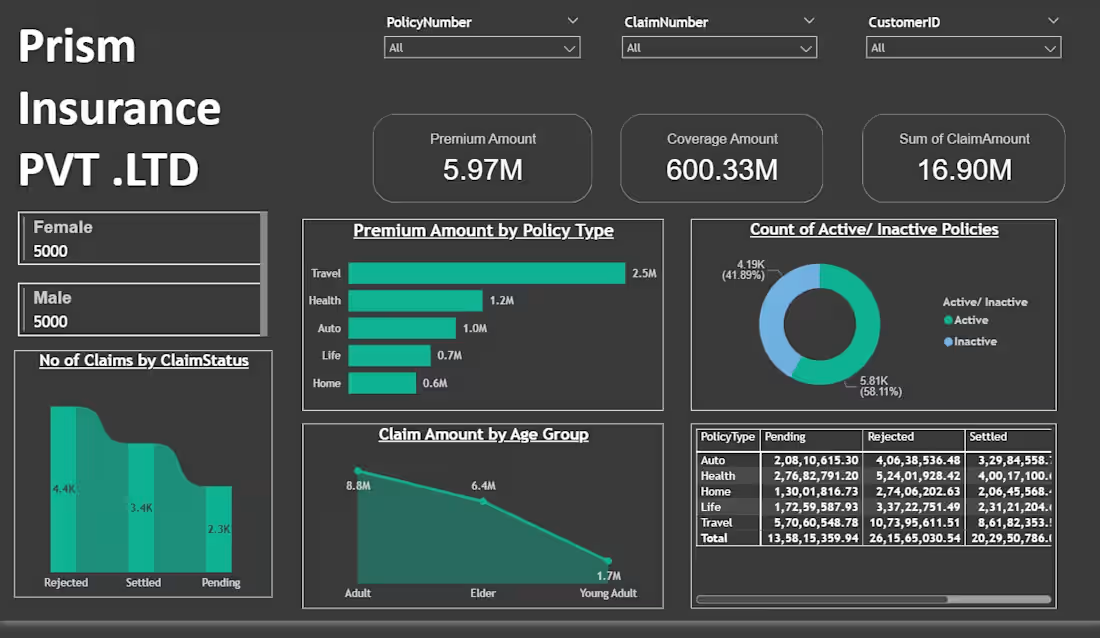
Insurance Analytics Dashboard | Power BI
Designed and developed an interactive Power BI dashboard for an insurance business to track policy performance, premium revenue, and claims insights in one unified view.
This dashboard enables stakeholders to move beyond static reports and gain real-time visibility into key business metrics, helping improve decision-making across operations, risk, and customer segments.
Business Value:
Identifies trends in claims vs premium collection
Helps detect high-risk segments and claim-heavy categories
Supports better policy pricing and risk assessment
Enables faster and more informed operational decision
0
29
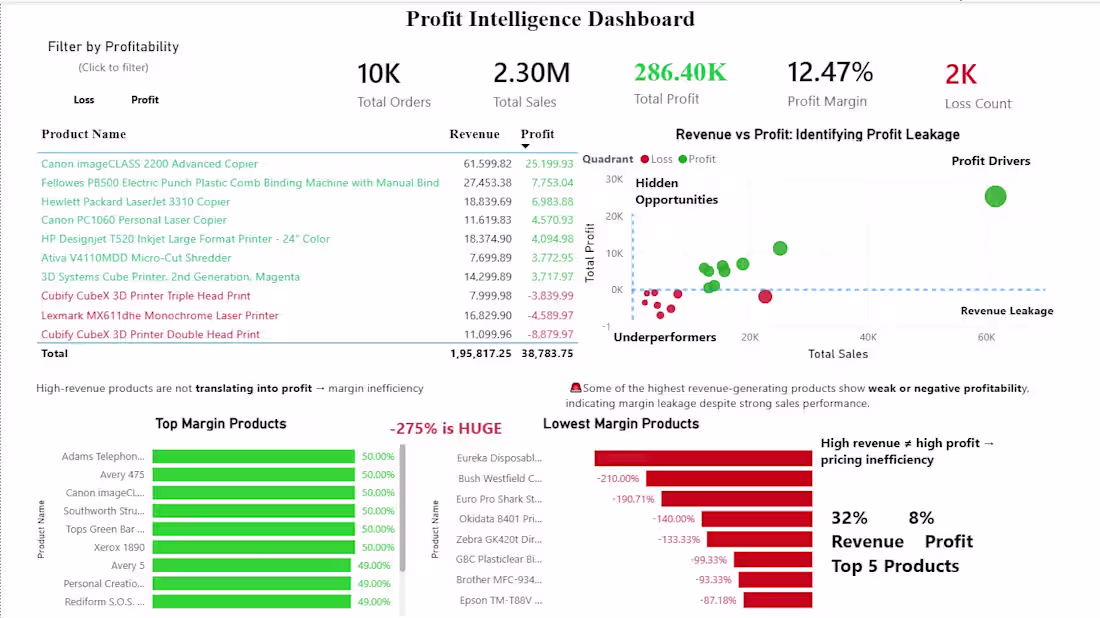
Profit Intelligence Dashboard | Power BI
Built an end-to-end Power BI dashboard focused on identifying profit leakage and margin inefficiencies at a product level.
This dashboard goes beyond tracking revenue and highlights where high-performing products are actually underperforming in terms of profitability.
Key Highlights:
Clear visibility into Total Sales, Profit, and Profit Margin
Identification of loss-making and underperforming products
“Revenue vs Profit” analysis to uncover hidden opportunities
Breakdown of top and lowest margin products
Actionable insights like:
High revenue ≠ high profit
Pricing and cost inefficiencies
Products driving losses despite strong sales
Impact:
Helps businesses shift focus from just revenue to profit-driven decision making, enabling better pricing, cost control, and product strategy.
3
5
201
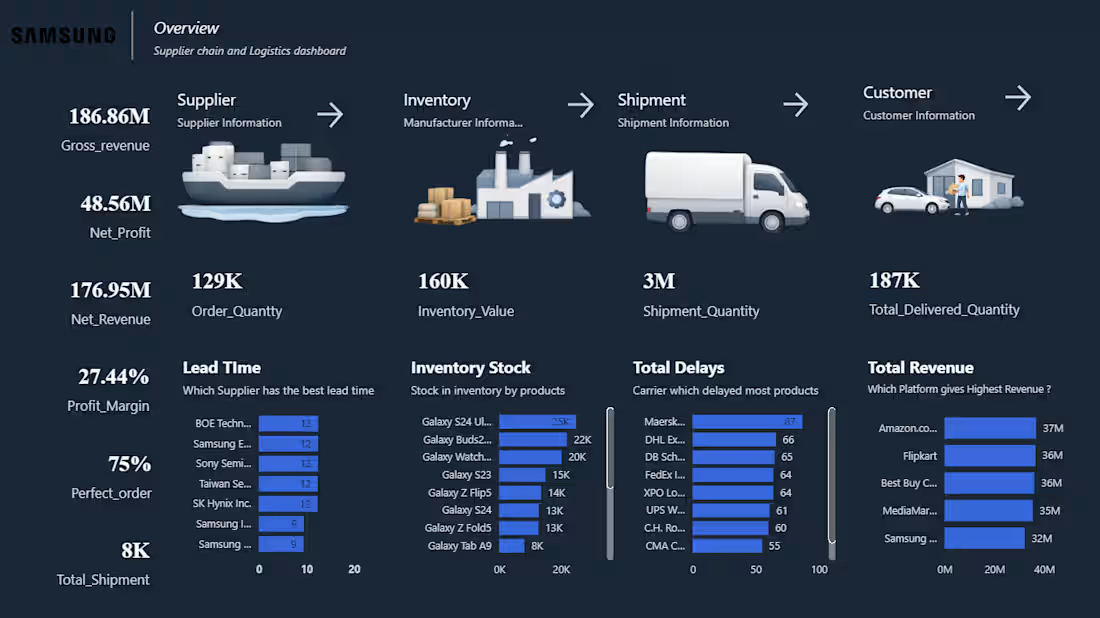
Supply Chain & Logistics Analytics Dashboard (Power BI)
This project focuses on analyzing supply chain operations to help businesses gain visibility into supplier performance, inventory levels, shipment efficiency, and revenue distribution.
The dashboard provides a comprehensive view of the entire supply chain process—from suppliers to final customers—allowing businesses to monitor operational performance and identify potential bottlenecks.
The dashboard also analyzes supplier lead times to identify vendors that consistently deliver orders faster and more reliably. This helps organizations evaluate supplier performance and optimize procurement decisions.
Power BI • Data Visualization • Business Intelligence • Data Analysis
2
81
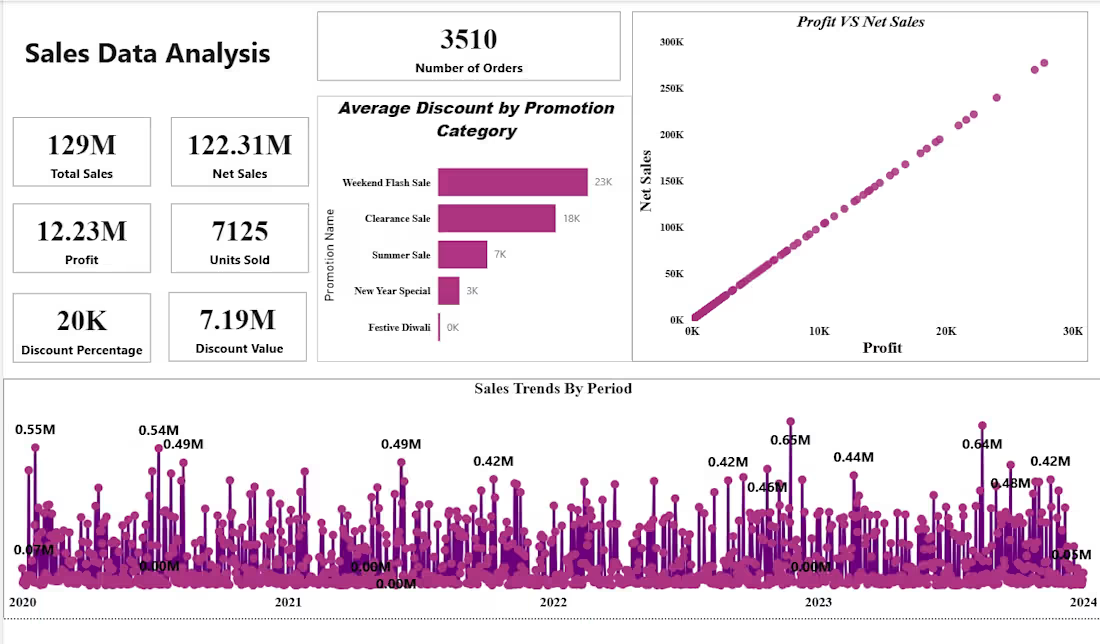
Sales Data Analysis Dashboard
This project focuses on analyzing retail sales performance using an interactive dashboard built with Microsoft Power BI.
The goal of this dashboard is to help businesses quickly understand their sales performance, profit trends, and the impact of promotional campaigns on revenue.
Dashboard Features
• Sales performance overview with key KPIs
• Profit vs Net Sales relationship analysis
• Average discount analysis by promotion category
• Time-based sales trend analysis from 2020–2024
• Visual comparison of different promotional campaigns
Business Value
This dashboard enables stakeholders to:
• identify high-performing promotions
• monitor profit and revenue trends
• track sales performance over time
• make data-driven business decisions
Tools Used
• Microsoft Power BI
• Microsoft Excel
1
64