
Franky Ndingwan
Power BI & Microsoft Fabric Consultant | SQL & Analytics
New to Contra
Franky is ready for their next project!
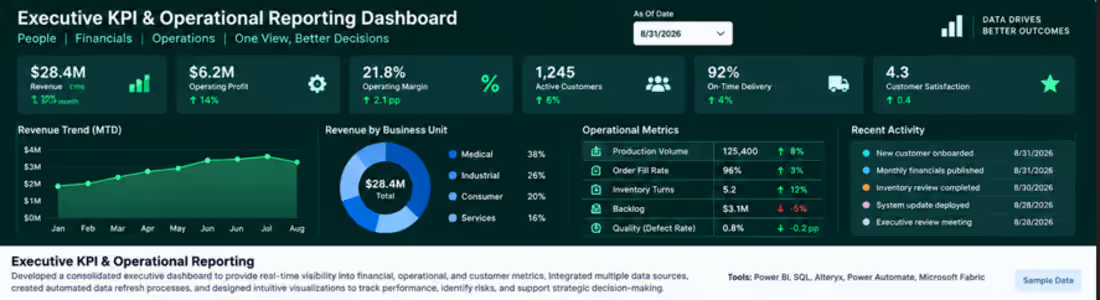
Executive KPI & Operational Reporting Dashboard. Developed an executive-level reporting solution that consolidates financial, operational, and customer KPIs into a single decision-making view. Designed automated reporting and intuitive visualizations to track revenue, profitability, customer activity, operational performance, trends, and emerging business risks.
The solution transforms complex data into clear executive insights while reducing manual reporting and helping leadership quickly identify areas requiring attention.
0
9
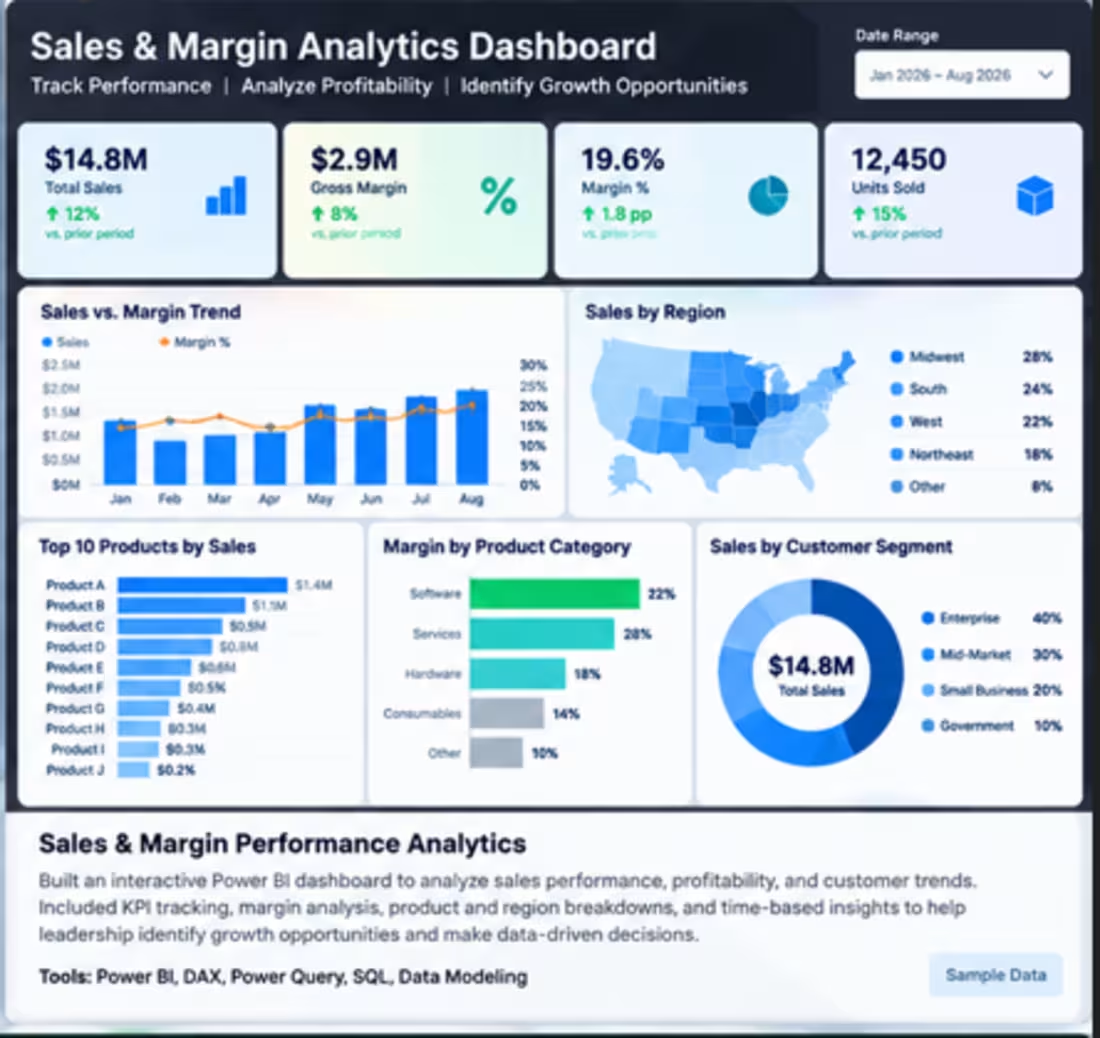
Built an interactive Power BI solution to analyze sales performance, profitability, and customer trends. Developed KPI tracking for sales, gross margin, margin percentage, units sold, product performance, customer segments, and regional performance.
Created time-based measures and drill-down analysis to help stakeholders identify growth opportunities, understand profitability drivers, and make faster data-driven decisions.
0
11
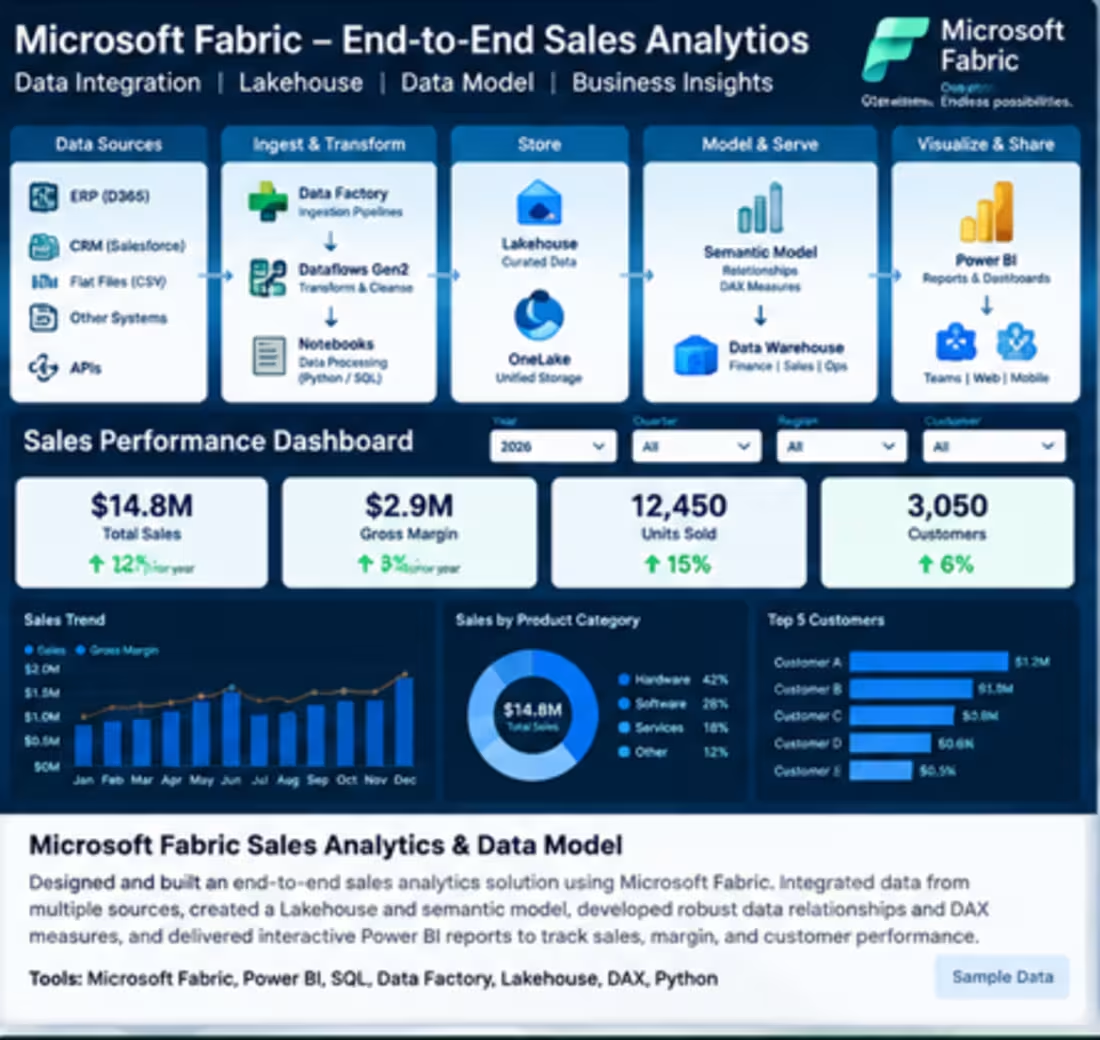
Designed and built an end-to-end sales analytics solution using Microsoft Fabric and Power BI. Integrated data from multiple sources, developed a Lakehouse-based architecture, created dimensional and semantic models, and built robust relationships and DAX measures to support sales, margin, customer, and product analysis.
The solution was designed with a strong focus on data quality, scalable modeling, and turning complex transactional data into reliable business insights for decision-makers.
0
14
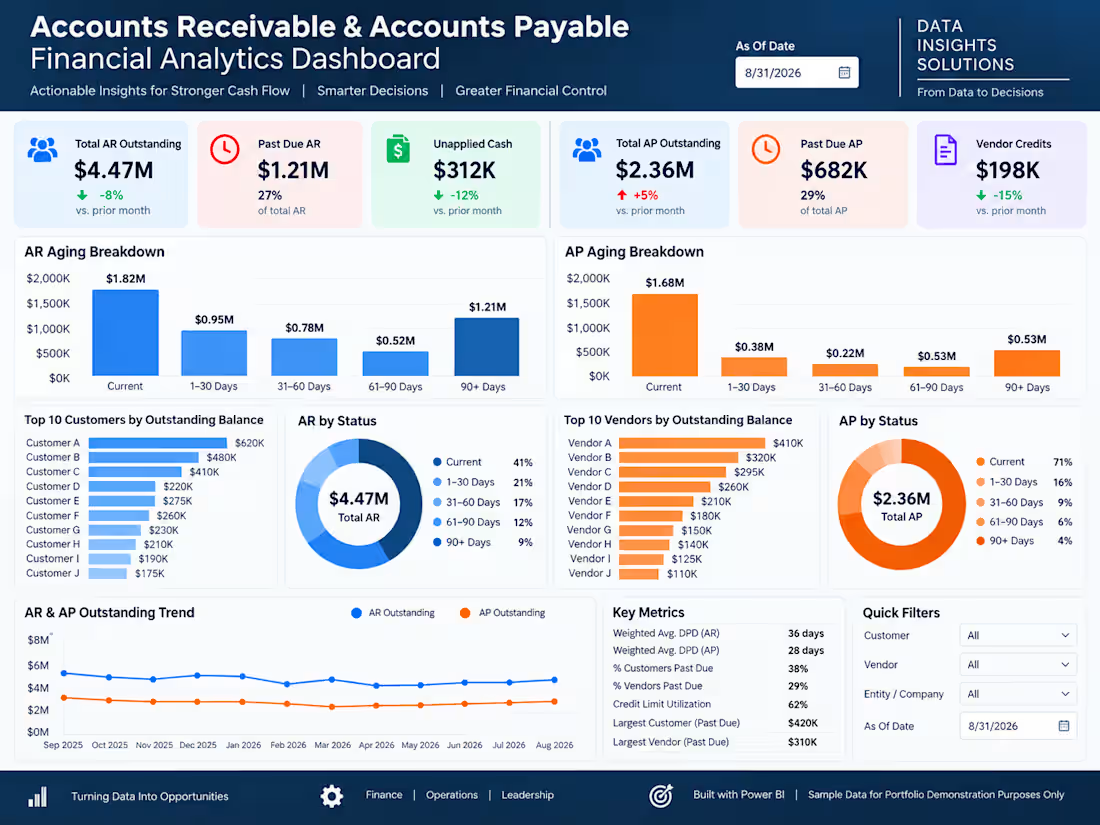
Built an interactive Power BI financial analytics solution to give finance and accounting teams a clear view of Accounts Receivable and Accounts Payable performance. The dashboard tracks outstanding balances, past-due exposure, aging buckets, unapplied cash, vendor credits, customer/vendor concentration, weighted days past due, and historical trends. I developed the data model, business logic, DAX measures, date-driven analysis, and executive-level visualizations to turn complex transactional data into actionable insights for cash-flow and working-capital decisions.
Tools: Power BI, DAX, Power Query, SQL, Data Modeling
Note: Visual shown uses sample data for portfolio demonstration purposes.
0
20