
Firdous Abbasi
Data Analyst | Power BI, SQL & automation specialist
New to Contra
Firdous is ready for their next project!
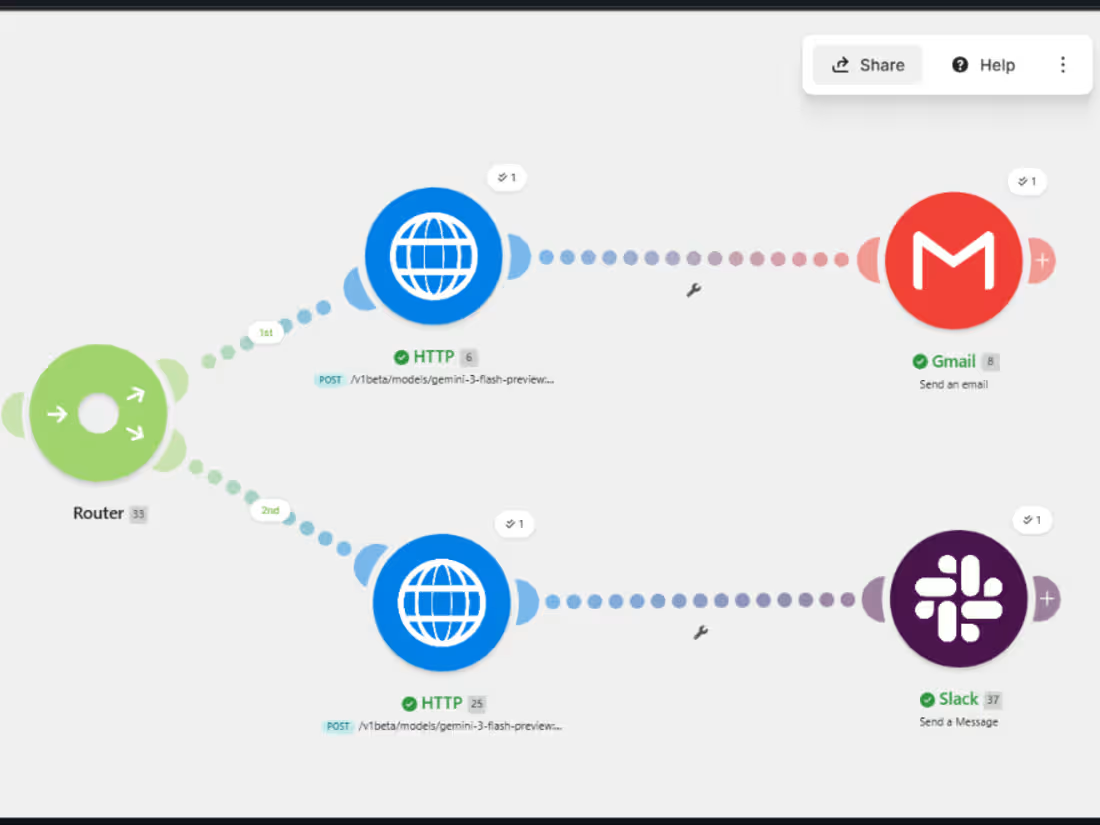
Designed an end-to-end AI sales reporting automation that turns raw sales data into clear business reports. The workflow helps save time, reduce manual reporting work, and share insights quickly with teams through automated delivery.
0
21
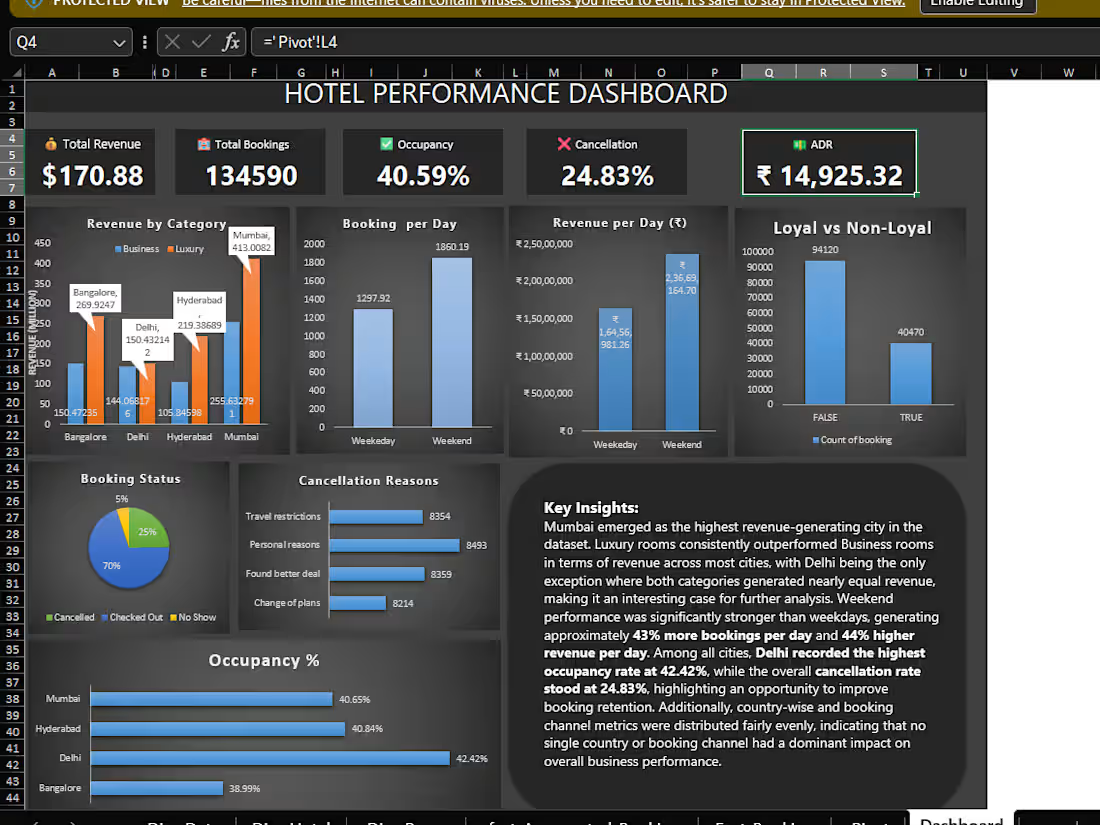
Built the Excel stage of a hospitality analytics dashboard for AtliQ Grands — the foundation
Designed KPI cards (Revenue, Bookings, Occupancy%, Cancellation%, ADR), pivot table analysis across occupancy, cancellation, loyalty membership, and booking channel, plus charts for revenue by category, booking status, and weekday/weekend performance.
Key finding: weekend bookings ran ~43% higher and weekend revenue ~44% higher than weekdays. Mumbai was the top revenue-generating city, and Delhi recorded the highest occupancy rate (42.42%).
🔗 GitHub: github.com/firdous-cloud-analyst/AtliQ-Grands-Hospitality-Performance-Dashboard
0
41
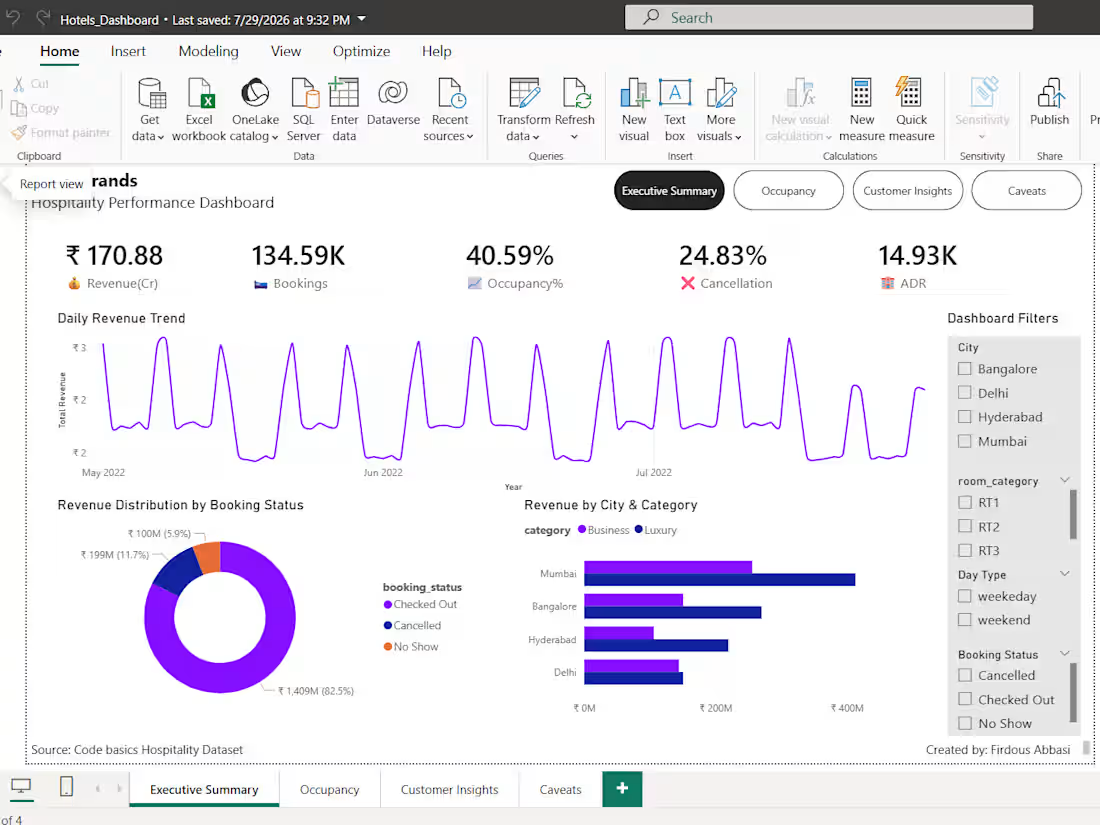
Built a 4-page Power BI dashboard analyzing hotel booking performance for AtliQ Grands across 25 properties in 4 Indian cities (Delhi, Mumbai, Bangalore, Hyderabad), covering May–July 2022.
Designed a star schema data model (dim_date, dim_hotels, dim_rooms, fact_booking, fact_aggregated_bookings) and built pages covering Executive Summary, Occupancy, Customer Insights, and a dedicated Caveats page documenting data limitations and QA methodology.
Key finding: weekend occupancy (51.85%) exceeded weekday occupancy (35.92%), and Delhi recorded both the highest occupancy (42.42%) and highest average guest rating (3.8/5).
🔗 GitHub: github.com/firdous-cloud-analyst/AtliQ-Grands-Hospitality-Performance-Dashboard
1
115
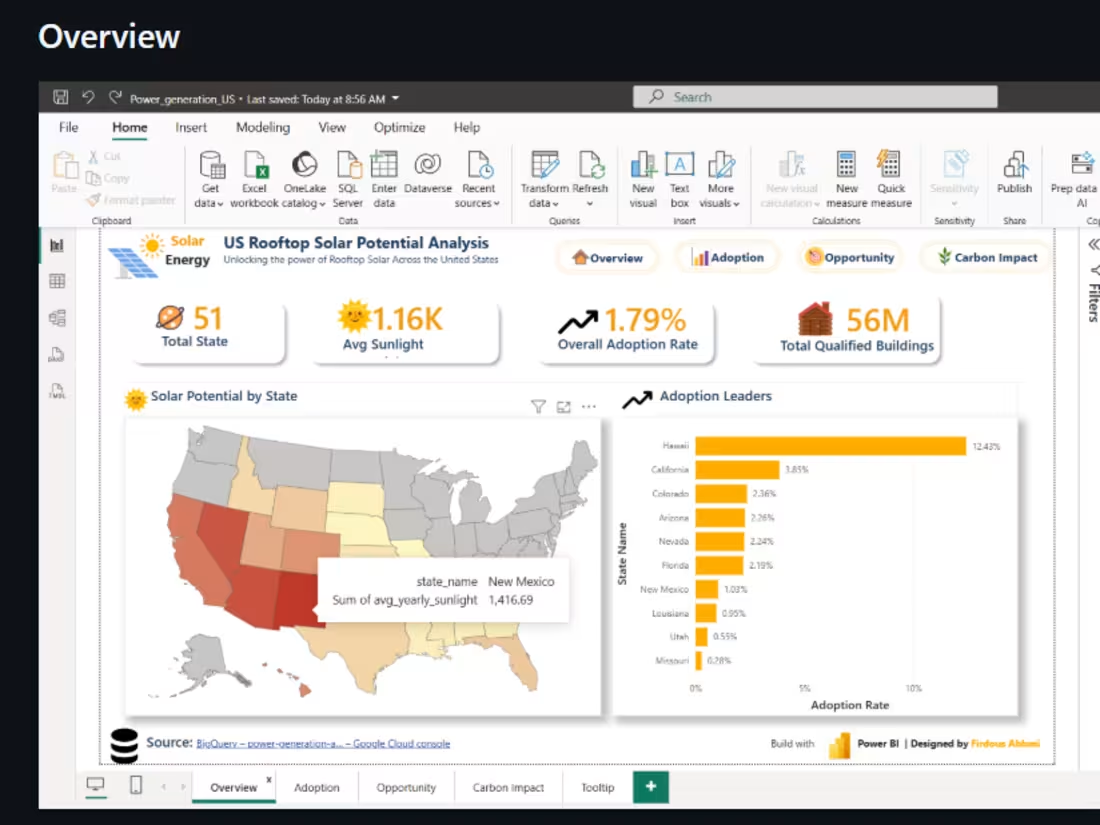
Analyzed rooftop solar potential across US states using Google's Project Sunroof dataset (Big Query) to identify high-potential, low-adoption markets for solar investment.
Built SQL analyses across four progressive difficulty levels in BigQuery, then designed a multi-page Power BI dashboard (Overview, Adoption, Opportunity, Carbon Impact) with custom theming, DAX measures, and Shape Map visuals.
Key finding: states with high energy potential but the lowest adoption rates — like South Dakota (0.21% median adoption) — represent the greatest untapped opportunity, offering a projected 7.75M total realized offset.🎉
🔗 https://github.com/firdous-cloud-analyst/US-Rooftop-Solar-Potential-Analysis
0
62