
Syed Faaris Razi
I make your data visible and your work automatic.
Profile in progress
Syed Faaris is building their profile!

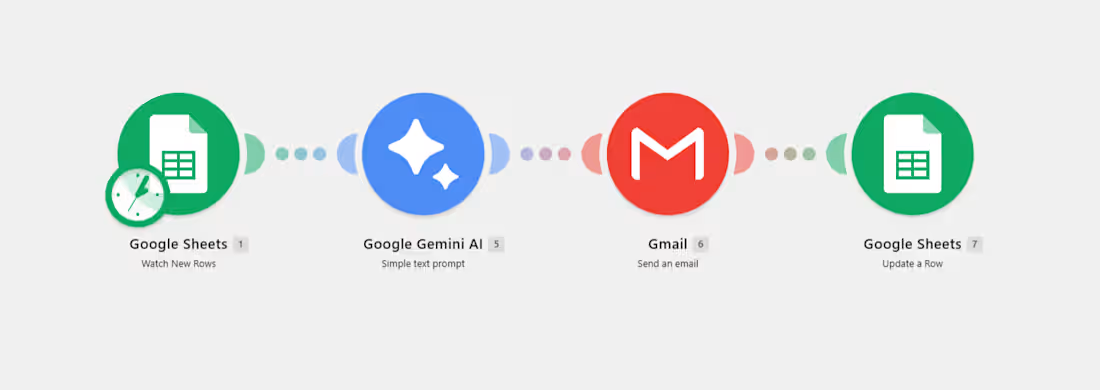
Every lead who fills out your form/contact on website, gets a personalised, human-sounding reply within seconds — while you're in a meeting, asleep, or with another client.
The moment someone submits your form, AI drafts a warm, specific reply referencing exactly what they asked about, sends it from your Gmail, and marks the lead as replied in your tracker — all instantly.
No more leads going cold because you didn't get back fast enough. No more copy-pasting the same follow-up email 20x a week. The first impression is handled, every time, before you even know the lead came in.
Built in Make.
0
30
🔧 Problem: Project and skill tracking were buried in densely maintained Excel files—limiting visibility across teams and departments.
✅ Solution & Outcome: Rebuilt two dynamic Power BI dashboards:
• For tracking project timelines, readiness KPIs, and manpower across projects.
• The 2nd: Employee-Skills distribution across departments and types.
Both dashboards included department-level visuals and dynamic keyword search (projects/skills). 🌟 Earned positive recognition from senior stakeholders—highlighting our team's value.
🛠️ Tools Used:
Power BI, DAX, Power Query, Python
0
81
📍 Problem: Opening a restaurant/business with no location profiling risks poor visibility, high competition, and low ROI.
🚀 Solution & Outcome: Used data-driven analysis (crime rates, venue types, proximity to downtown, competitors) and K-means clustering to reveal Winnipeg neighborhoods with the highest potential — helping clients choose optimal launch areas with confidence.:
🛠 Tools Used: Python; Geocoder (arcGIS), Pandas, Folium, Plotly, Sklearn, Foursquare API
0
103
☀️ Problem:
Energy team lacked a tool that offers users location-specific solar (PV system) performance and financial ROI dynamically.
✅ Solution & Outcome:
Built an interactive solar & ROI web app 🔍 where users click/pinpoint a location on a map with selected PV System components, to get custom KPIs, sun charts, and ROI/payback forecast. 💬 Received positive feedback, sparked interest to extend or integrate it's functionality to an existing tool.
🛠️ Tools Used:
Python, Anvil.works (http://Anvil.works), PVLIB (Sandia), Plotly
0
70