👋 Hi Contra — I’m Lilya, a Data Scientist working at the intersection of retail, demand forecasting, and promotion analytics.
My recent work focuses on SKU-level forecasting, where small modeling choices have a big business impact:
• 📦 Improving SKU-level demand forecasts for planning & inventory
• 📊 Approximating the pull-forward effect of promotions
On the technical side, I work end-to-end:
• Time-series & ML forecasting
• Promo, price & calendar feature engineering
• PySpark batch pipelines & MLflow tracking
💡 Open to freelance or contract projects around demand planning, retail analytics.
Happy to connect 🚀
0
344
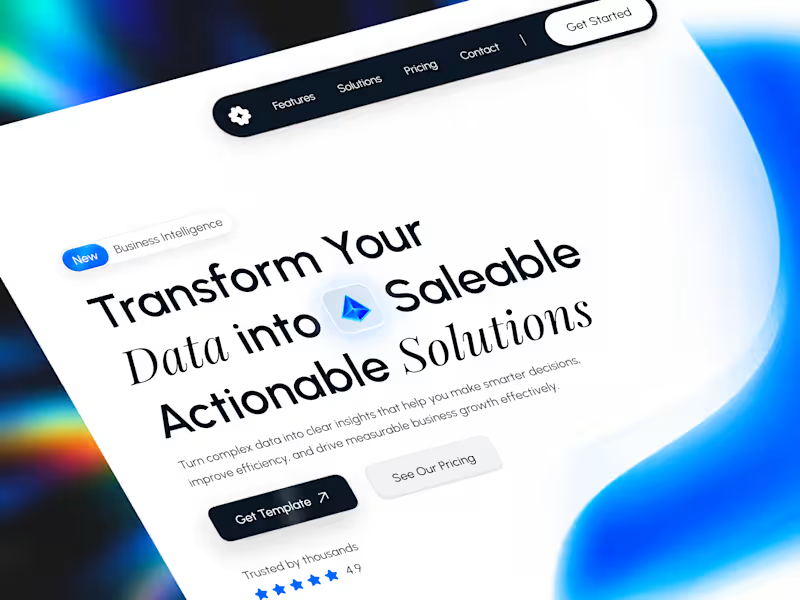
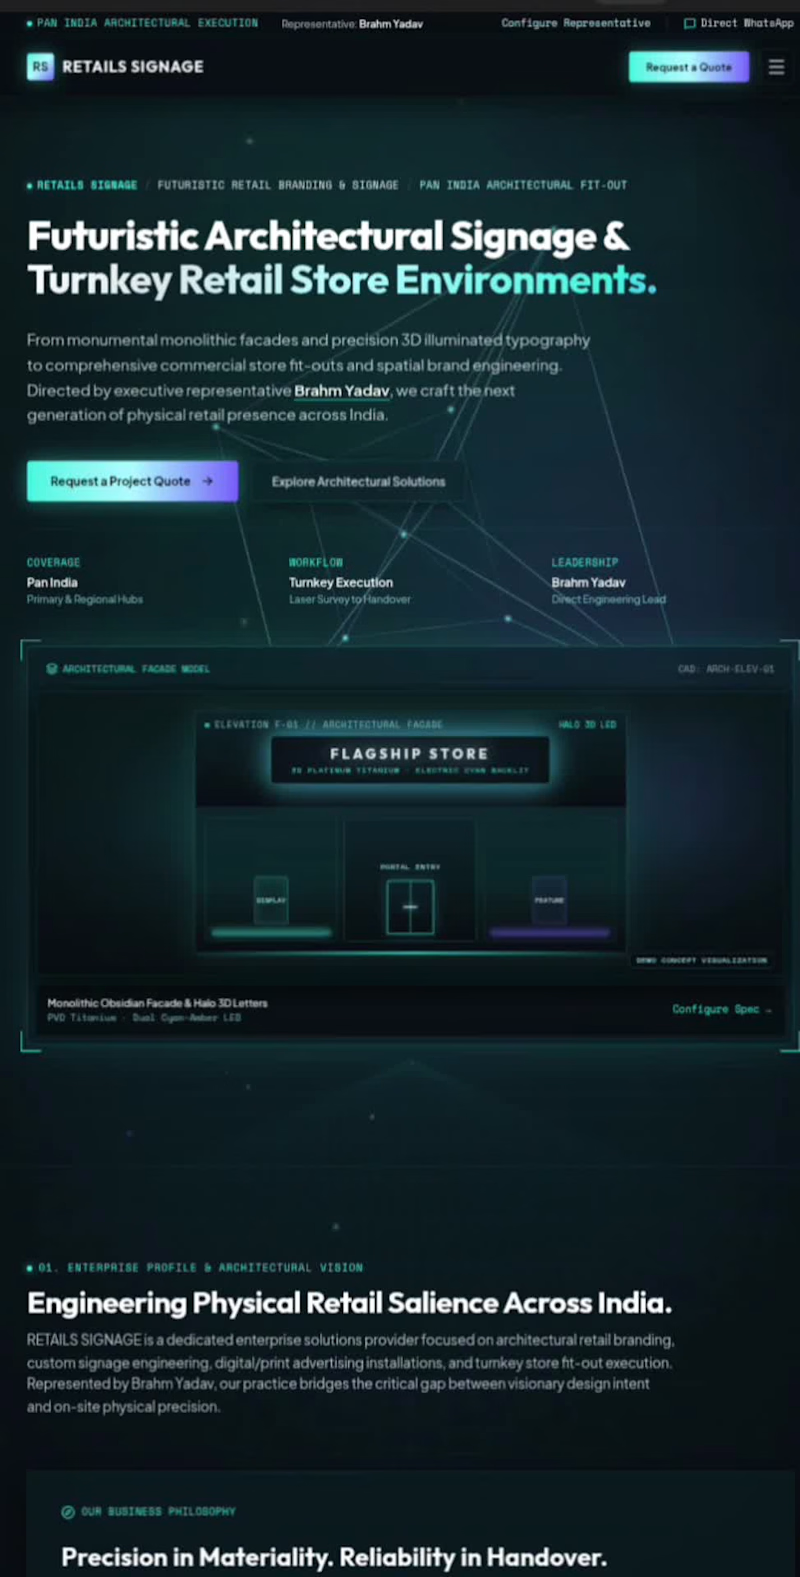
Retails Signage – Premium Website & Advertising Experience
Designed and developed a modern digital website concept for Retails Signage, focused on presenting its brand identity and advertising solutions through a professional, visually engaging experience.
The project explores a clean, premium interface with structured layouts, refined typography, responsive design principles, and a strong visual presentation.
Project Highlights
Modern Website Design: A professional digital presence with a clean and organized layout.
UI/UX Experience: User-focused navigation and structured content presentation.
Brand Presentation: A visual approach designed to communicate the company's identity.
Print Advertising: A dedicated presentation of print advertising concepts.
Online Advertising: A digital advertising presentation concept.
Other Advertising: A dedicated section for additional advertising concepts.
Responsive Design Approach: Layout designed with different screen sizes in mind.
Design & Development
The initial website concept was created using Google AI Studio, with a focus on modern web design, visual consistency, and professional brand presentation.
Project Status: Initial Demo / Work in Progress
Designed & Developed by Subham Tripathi
Web Designer | UI/UX Designer | AI & Web Development
1
51
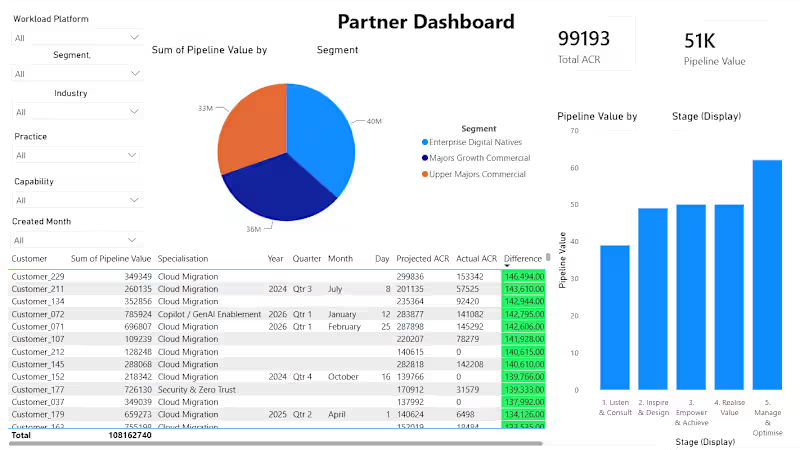
Project Title: Enterprise Sales Intelligence & Governance Dashboard (PoC)
The Strategy:
Before deploying the full-scale governance model, I architected this Proof of Concept (PoC) to validate data-source alignment and core reporting requirements with key stakeholders.
The Outcome:
This prototype allowed us to stress-test the data model and refine the KPIs, ensuring the final, production-grade dashboard was perfectly aligned with executive decision-making needs.
1
140


I engineered a large-scale package-network intelligence pipeline using Azure Databricks and PySpark. The system joined approximately 4.5 billion historical records and transformed them into reusable fingerprint signals covering package movement and network behavior.
I developed time-windowed feature logic using native Spark expressions rather than Python UDFs, preserving distributed performance at scale. The pipeline produced an approximately 200-million-row fingerprint dataset and a 22-million-row operational output that classified package activity along a cold-to-hot temperature scale.
The resulting signals supported downstream monitoring, prioritization, and operational analysis. The architecture shown here is a sanitized representation; client identifiers, proprietary schemas, infrastructure paths, and business rules have been removed.
1
294


Azure Data Pipeline for E-commerce Analytics :
E-commerce teams drown in raw sales CSVs and scattered APIs—while revenue leaks hide in untracked product returns and regional stock-outs. I built a cloud-native, end-to-end analytics pipeline that turns chaotic transactional data into sub-minute Power BI insights, letting merchandisers act on trends before they become costly mistakes.
0
108


Enterprise AI Trend-Intelligence Platform
Designed an end-to-end intelligence platform that translated fragmented market and consumer signals into prioritized opportunities. Combined AI strategy, solution architecture, and delivery leadership to create a scalable decision workflow that generated $2M+ in annual savings.
0
35
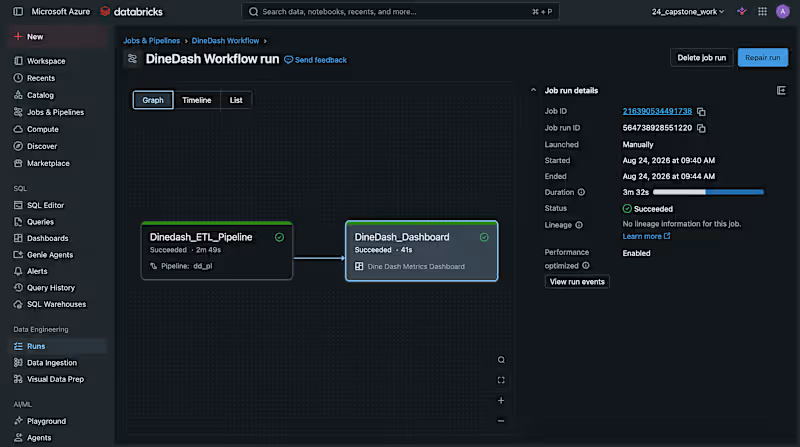
I designed and deployed an end-to-end Enterprise Lakehouse on Azure Databricks for DineDash, a multi-city food delivery platform.
The business was facing severe data fragmentation across disparate CSV dimensions and streaming JSON orders, along with data quality gaps that distorted revenue and driver metrics.
To solve this, I built a production-grade Medallion Architecture combining Unity Catalog Volumes, Delta Live Tables (DLT) with real-time Data Quality firewalls, 27 SQL analytical models, an Executive BI Dashboard, and an Automated Databricks Workflow DAG that refreshes the entire platform seamlessly without manual intervention."
0
40

Main analyst for the Supply Loyalty program, maintaining engagement of our main supply source in the Rides Vertical.
Interim Lead for the Supply Analytics team for 6 months, during which i’ve provided valuable guidance to my peers and regular 1-1s, clarifying ambiguous requirements, delegating functional tasks
In my time as interim lead, i have also brought in Focus days as part of a 20% discovery time agreement. I have also introduced a review system for our work in order to increase the quality of our output
End-to-end feature development, from recognising high stakes opportunities to delivering in-app experiences through data modelling.
Cross functional collaboration, with stakeholders such as Group Product Managers, Engineering Managers and functional analytics leads
Personal roadmap management guaranteeing on time delivery, completely autonomous
Mentoring of other colleagues during organisational changes, such as highlighting opportunities that could benefit both org and individual contributors
0
60