AI Software Engineer


Founder / Software Engineer

Building Modern Data Platforms: Snowflake, Kafka & dbt
New to Contra
Building Modern Data Platforms: Snowflake, Kafka & dbt
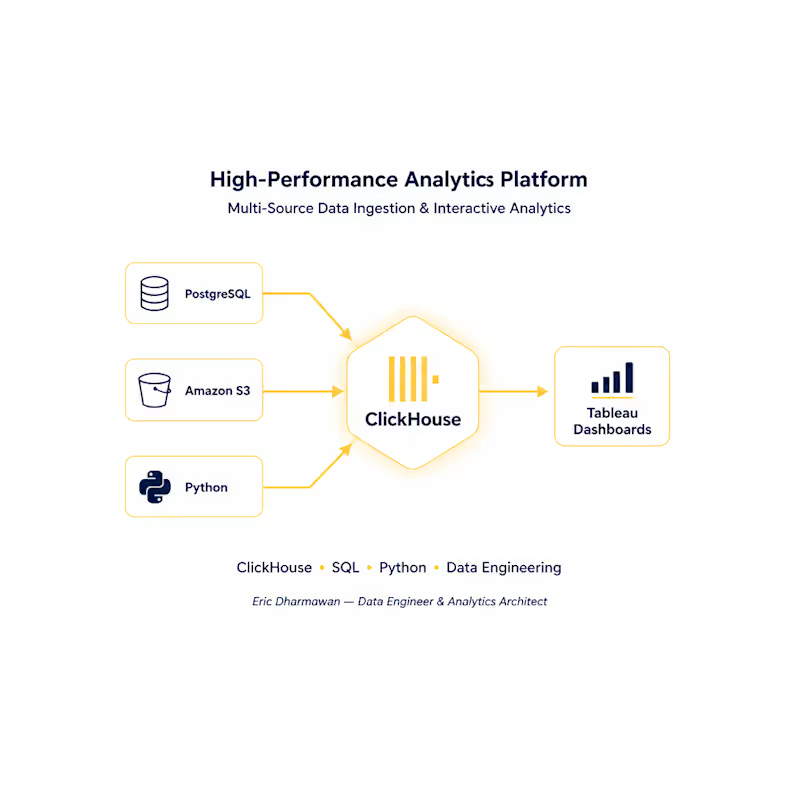
I built this High-Performance ClickHouse Platform to make large-volume analytics feel effortless and instantly visual. Watch how we transformed raw records into Tableau-ready insights, and leave a comment if you think scalable architecture deserves an award! 🏆✨
🚀 The Stack: ClickHouse | PostgreSQL | Amazon S3 | Python | Tableau
We conquered massive volumes of attendance and payment data by building a unified ingestion workflow. By pulling multi-source data into strictly designed ClickHouse analytical tables, we delivered a reusable, highly scalable architecture that powers fast queries and interactive business dashboards without breaking a sweat. 💡⚙️
0
24
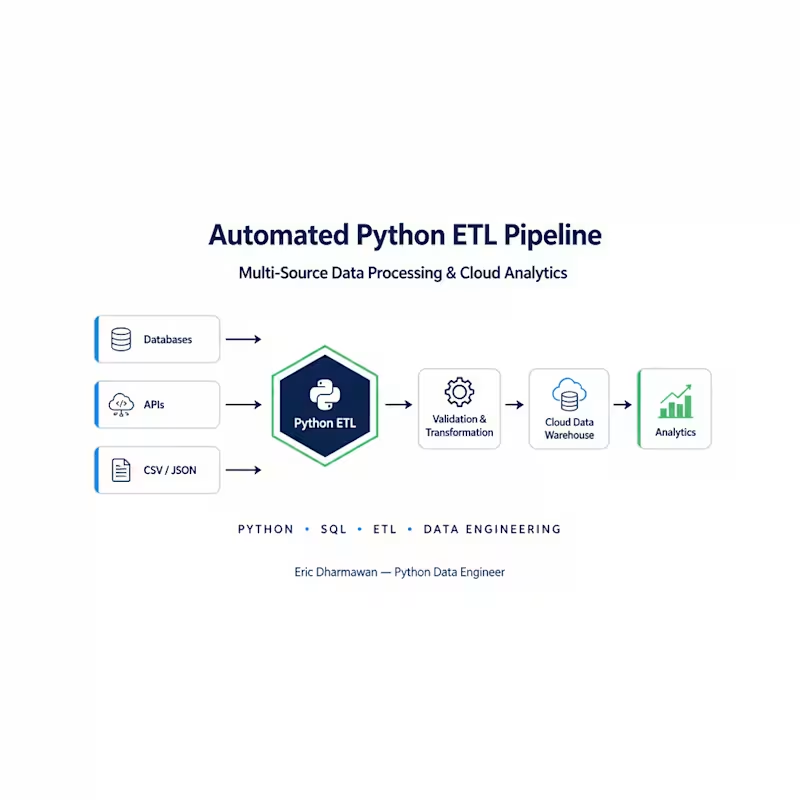
I built this Automated Python ETL Pipeline to make data extraction and cleansing feel effortless and completely hands-free. Watch how we transformed messy inputs into cloud-ready tables, and leave a comment if you think wiping out manual data entry deserves an award! 🏆✨
🐍 The Stack: Python | SQL | Cloud Analytics | APIs & Flat Files
We rescued business teams from the nightmare of manual data preparation. By engineering a highly reusable, error-logged Python framework, we seamlessly ingested flat files, databases, and APIs. The result is a rock-solid batch processing engine that cleanses, validates, and delivers curated datasets straight to the cloud. ☁️📊
0
22
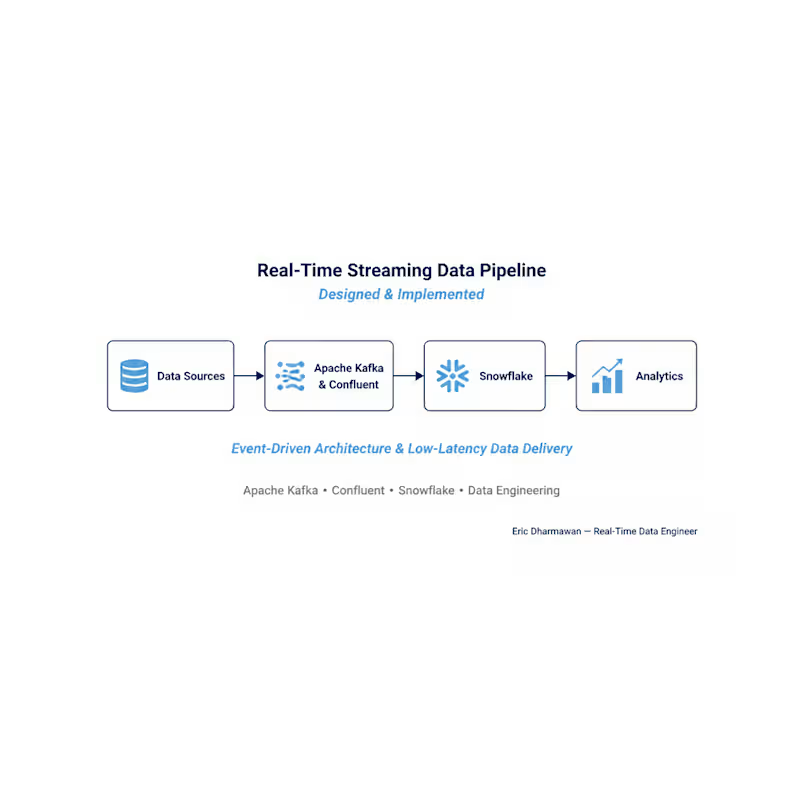
I built this Event-Driven Streaming Pipeline to make live analytics feel effortless and instantaneous. Watch how the data flows from source to warehouse, and leave a comment if you think low-latency engineering deserves an award! 🏆✨
🚀 The Stack: Apache Kafka | Confluent | Snowflake | Data Engineering
We broke free from the chains of slow batch processing. By engineering a highly scalable stream using Kafka and Confluent, we ingested live event data directly into Snowflake—slashing latency and unlocking immediate downstream reporting for the business. 📊🔥
1
37
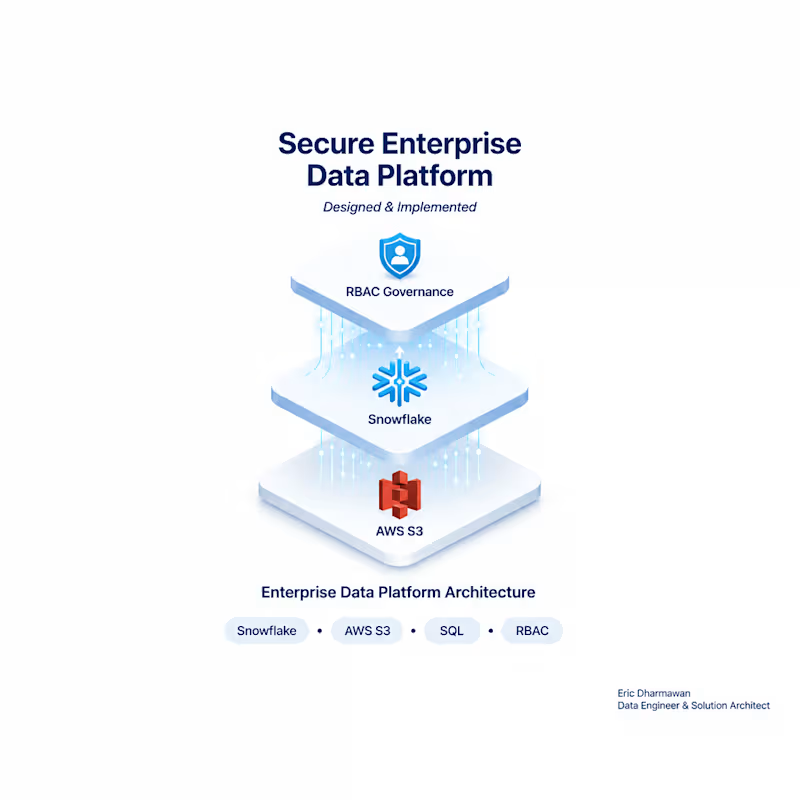
I built this Secure Enterprise Data Platform to make scalable analytics feel effortless and completely bulletproof. Watch how we structured the environments and leave a comment if you think clean data governance deserves an award! 🏆✨.
The Stack: Snowflake | AWS S3 | SQL | RBAC
We took raw cloud storage and transformed it into a governed analytics engine. By establishing strict role-based access control (RBAC) across dedicated dev and prod environments, we empowered multiple business teams with secure, maintainable, and production-ready data operations.
1
59

Senior Product Engineer Building AI Products


i tell computers to do whatever i want them to do

I made a custom logging platform for my apps, its free and open source, still working on a few improvements but currently it supports:
- Real time logs from multiple apps
- App Monitoring and Down Detection
- Email Alerts
- A bit of AI integration cuz why not (though its only available in cloud hosted version)
Check out logui.xyz (https://logui.xyz) - a light-weight logging platform for your self hosted applications.
1
234


Data Infrastructure · Systems Analysis · Polymath

Geospatial data pipeline in active development — ClickHouse infrastructure with 5.6M+ rows of bike-share data, integrated weather and holiday data, SQL schema, validation queries, and Python pipeline. Tableau animated visualization layer in build-out. Tools: ClickHouse · Python · SQL · Tableau.
1
114

Multi-dimensional retail sales analysis built in Tableau — year-over-year breakdowns by region, state, department, and product mix with revenue projections. Includes bottom performer identification, sales per square foot, and quarterly trend analysis across multiple dashboard views. Tools: Tableau · Data Analysis.
0
68


Analista de Datos | Insights, modelos | optimización | ML
Analista de Datos | Insights, modelos | optimización | ML

Multi-Horizon Demand Forecasting
Designed and implemented a multi-horizon demand forecasting system for an e-commerce business to improve inventory planning and operational decision-making.
The solution generated forecasts across multiple planning horizons while automating forecasting workflows and scenario analysis.
This enabled business teams to make more informed purchasing and inventory decisions while reducing manual forecasting efforts.
0
36
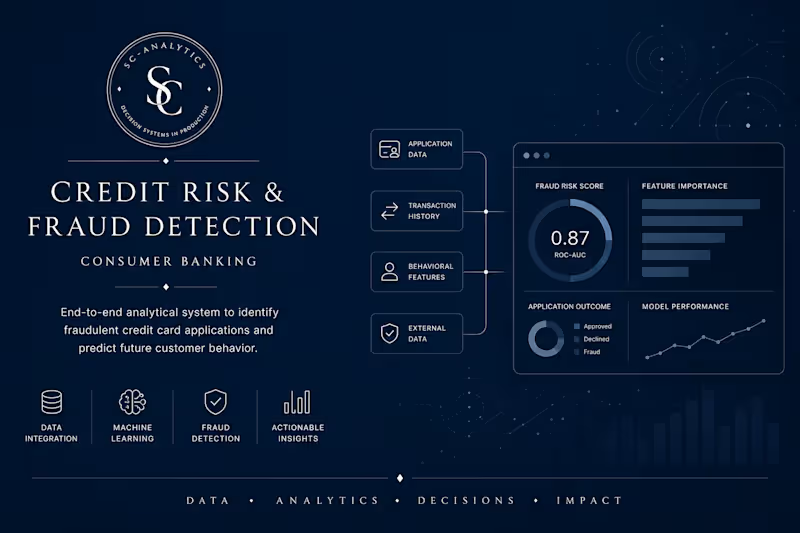
Credit Risk Modeling
Developed a machine learning solution for consumer credit risk assessment, helping improve lending decisions through predictive analytics.
The project included feature engineering, model evaluation and probability calibration to deliver reliable risk predictions while supporting regulatory and business requirements.
The final solution provided a scalable analytical framework for consistent and data-driven credit decision making.
0
53

Built a centralized investment analytics and business intelligence platform to automate KPI tracking, operational reporting and executive dashboards.
The solution integrated multiple data sources into a single decision support system, eliminating manual reporting while providing daily insights into investments, clients, providers and overall business performance.
The platform included automated data pipelines, KPI monitoring and executive dashboards designed to support faster and more informed business decisions.
0
55

Designed an AI-powered decision support system combining quantitative models, machine learning and deep learning techniques to analyze financial markets.
The platform automated data collection, strategy evaluation and backtesting, providing a scalable framework for continuous strategy development.
The project demonstrated how advanced analytics can support systematic and data-driven investment decisions.:
0
56

Go backend fixes & cloud cost cuts. AWS→Hetzner migrations
New to Contra
Go backend fixes & cloud cost cuts. AWS→Hetzner migrations