
Cherrie Cosby
Data Infrastructure · Systems Analysis · Polymath
New to Contra
Cherrie is ready for their next project!
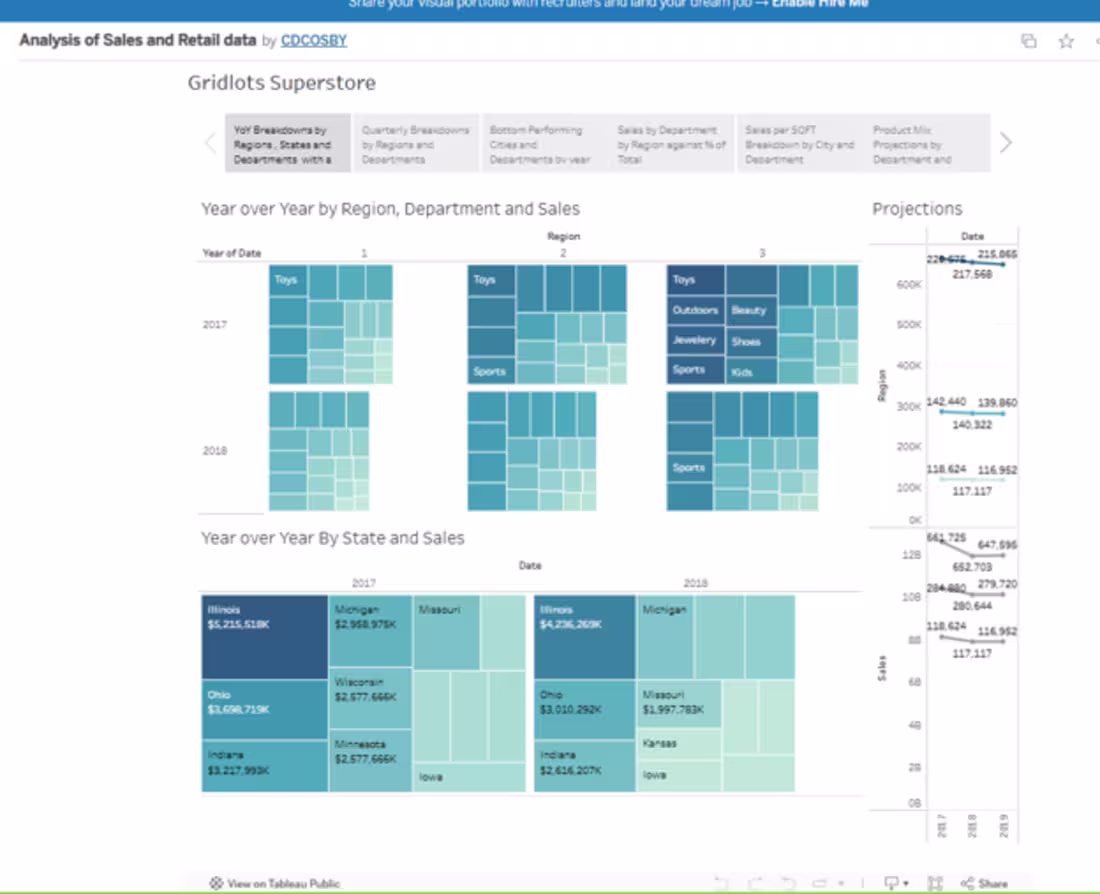
Multi-dimensional retail sales analysis built in Tableau — year-over-year breakdowns by region, state, department, and product mix with revenue projections. Includes bottom performer identification, sales per square foot, and quarterly trend analysis across multiple dashboard views. Tools: Tableau · Data Analysis.
0
37
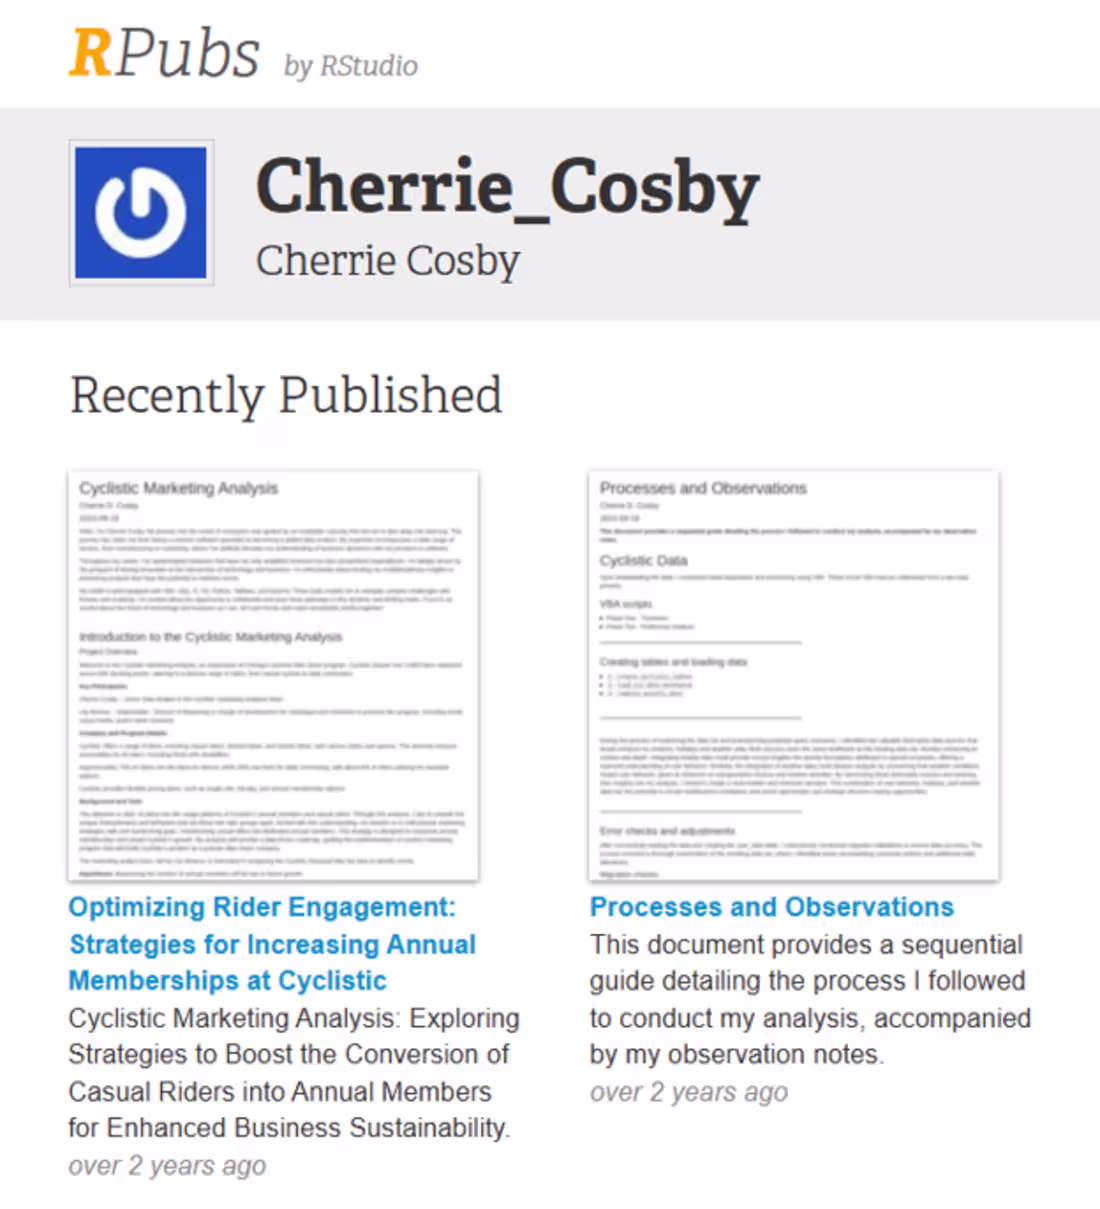
Full data analysis in R examining Cyclistic bike-share rider behavior — comparing casual riders vs annual members to develop data-driven marketing strategies for membership conversion. Published on RPubs. Tools: R · RStudio · ggplot2 · tidyverse.
0
54
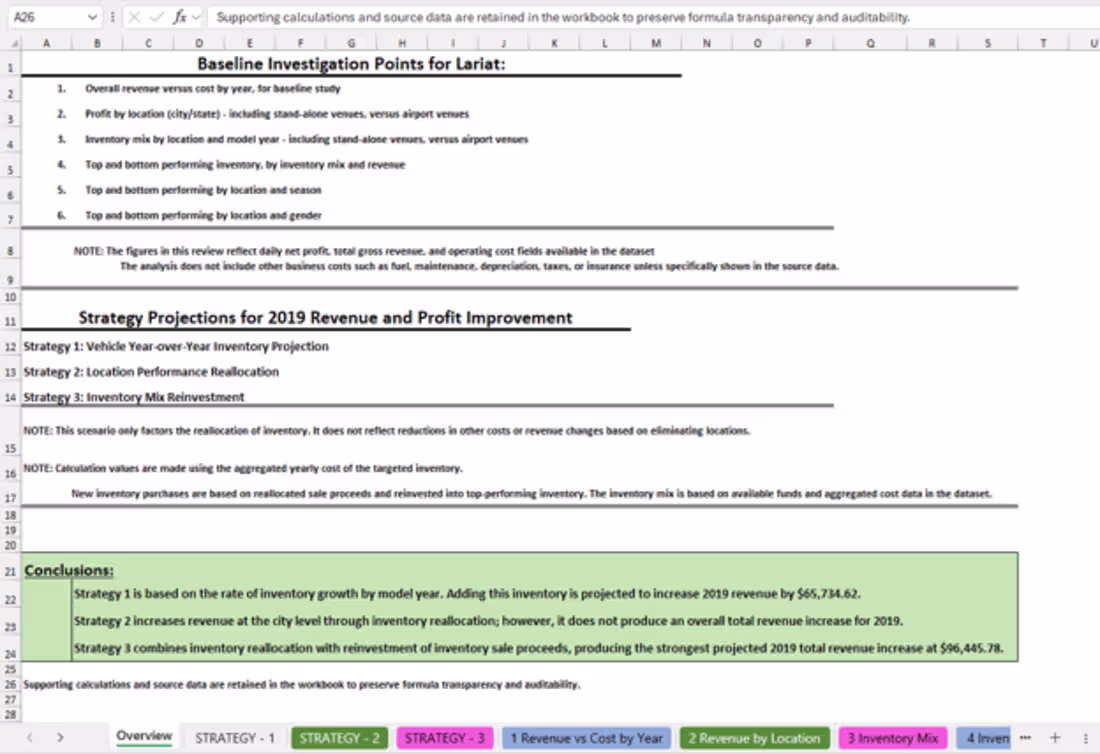
Business analysis for Lariat Car Rental — examining fleet utilization, revenue trends, and operational performance across locations. Full analysis includes data cleaning, exploratory analysis, and visualizations built in Excel. Published case study available online.
0
36

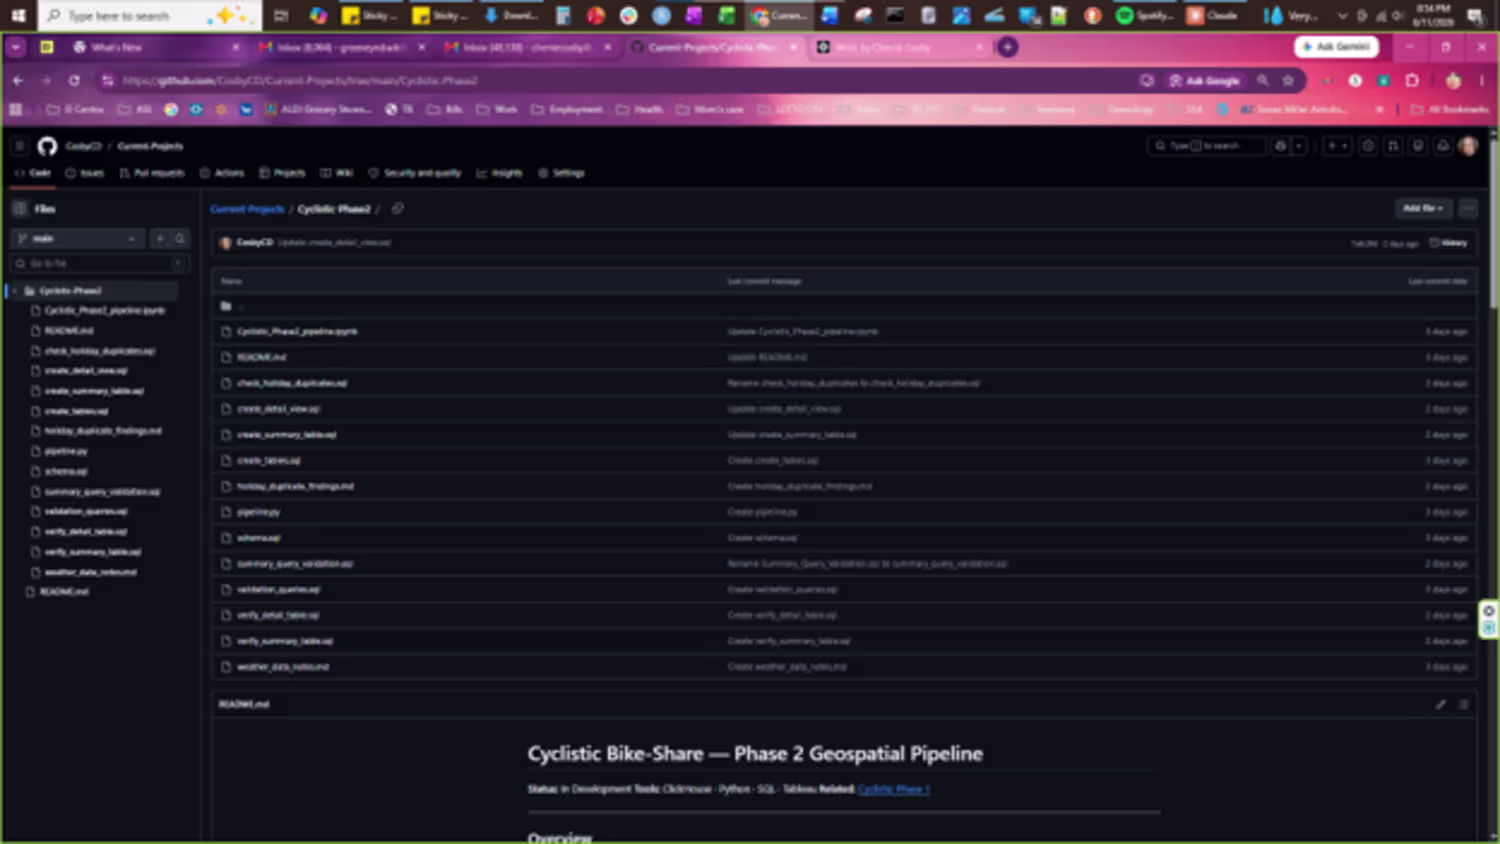
Geospatial data pipeline in active development — ClickHouse infrastructure with 5.6M+ rows of bike-share data, integrated weather and holiday data, SQL schema, validation queries, and Python pipeline. Tableau animated visualization layer in build-out. Tools: ClickHouse · Python · SQL · Tableau.
0
46