Freelance Business Analysts
Freelance Business Analysts
Sign Up
Post a job
Sign Up
Log In
Filters
1
Projects
People
2
Hanna Serednytska
pro
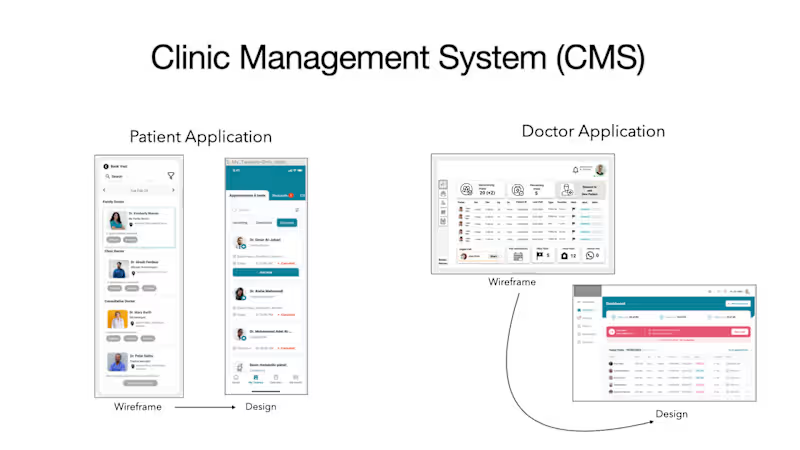
Clinic Management Platform (CMS) for Digital Healthcare
1
2
93
0
Muna Anazodo
Wellness Supplement Market Presentation
0
13
6
Andy Luo
pro
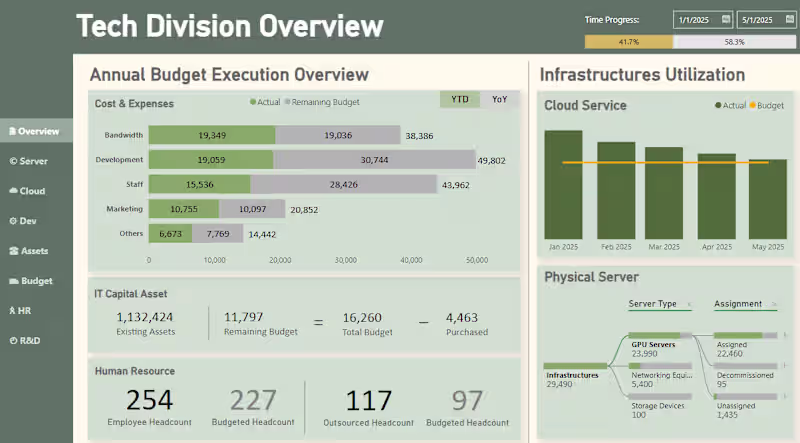
Budget Execution Analysis PowerBI Visualization
6
173
0
Darren Pierson
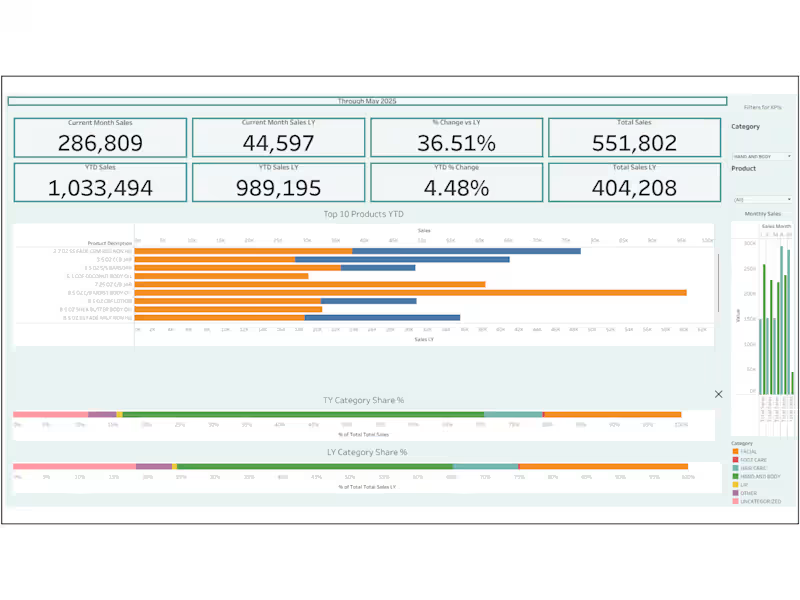
Sales KPI Insights in Tableau
0
29
0
Priya Krishnamoorthy
Integrating Kindness into Organisational Storytelling
0
4
0
Brian Logan
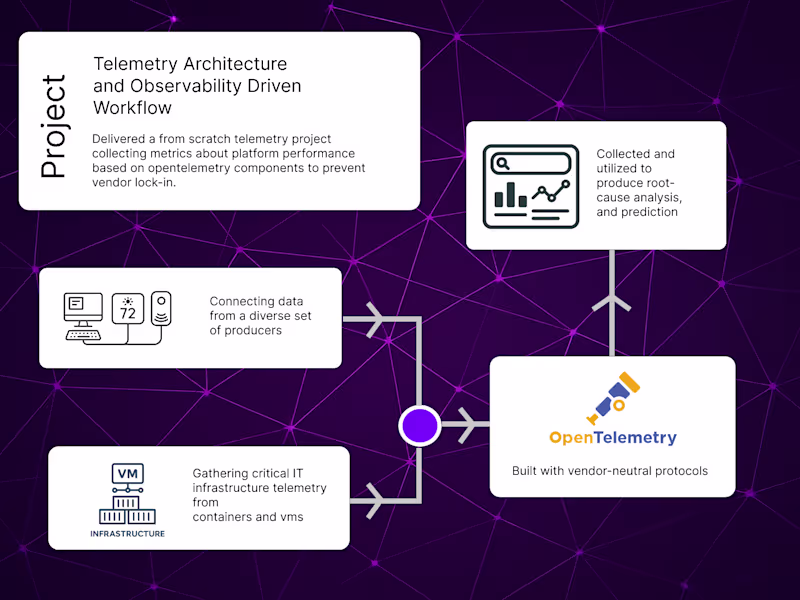
Observability Engineering
0
9
0
Rebecca Jenek
pro
Global Mobility Accounting & Payroll Risk Mitigation
0
8
0
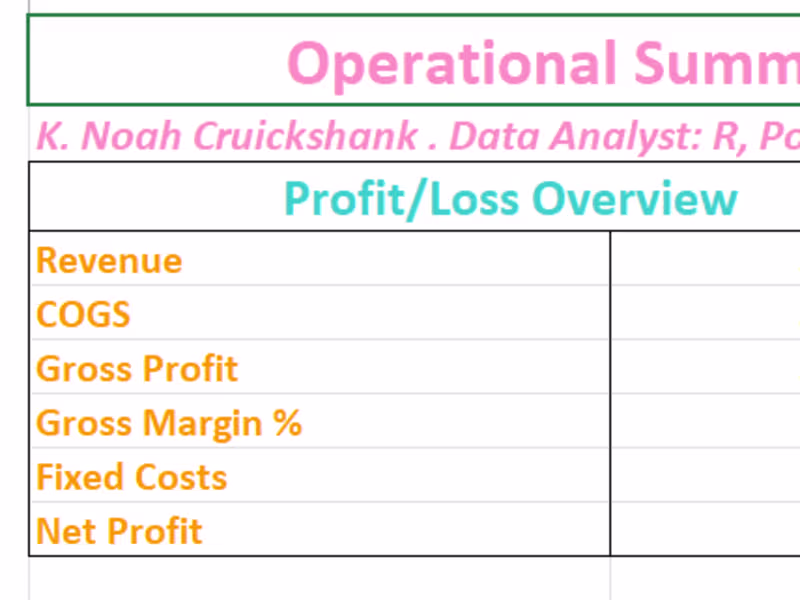
Kaedyn Cruickshank
Profitability Model
0
13
1
Jessica Alberton
Cloud cost reduction project - How much does a dashboard cost?
1
8
0
Oleksii Voronin
Nuttele.
0
2
0
Jacque Hill
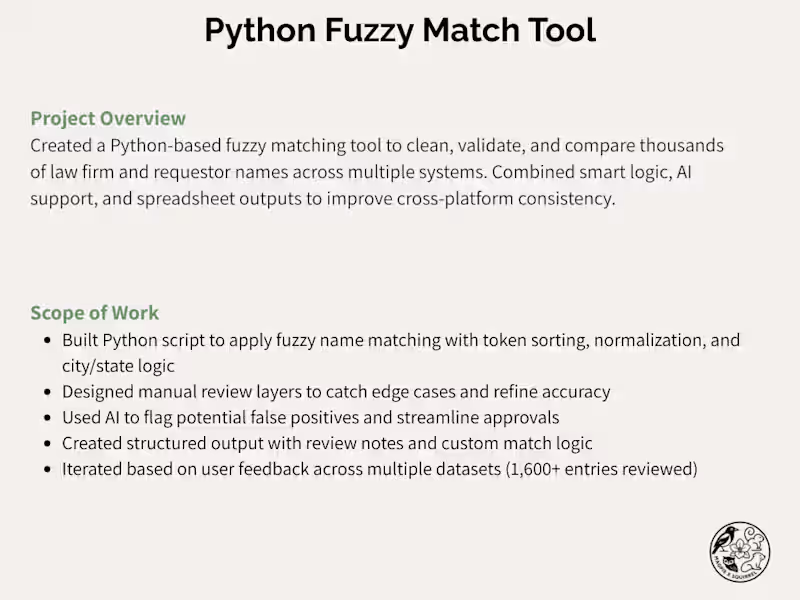
Python Fuzzy Match Tool – Smart Data Validation System
0
5
1
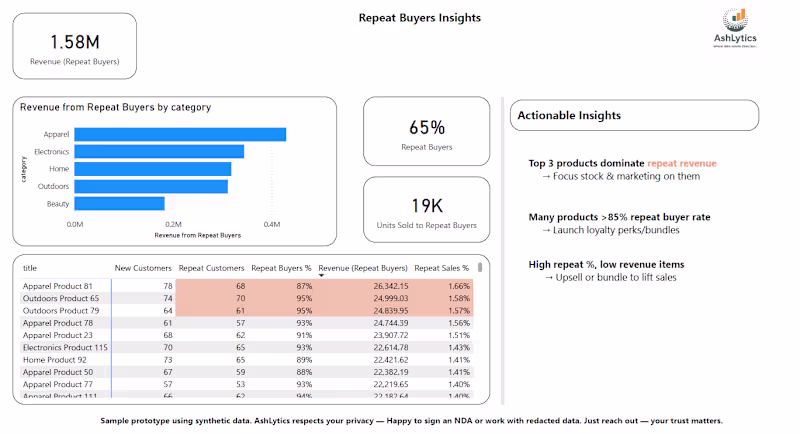
Ashish Srivastava
Repeat Buyers Insights
1
14
0
Will Hawkins
Bootstrapped
0
27
0
Rubein PM
Market Analysis & Investment Opportunities, Luis, february 2025
0
7
1
Manu Gupta
pro
Streamline Kajabi cross platform automations & integrations
1
7
3
Geethasree Naguboina
pro
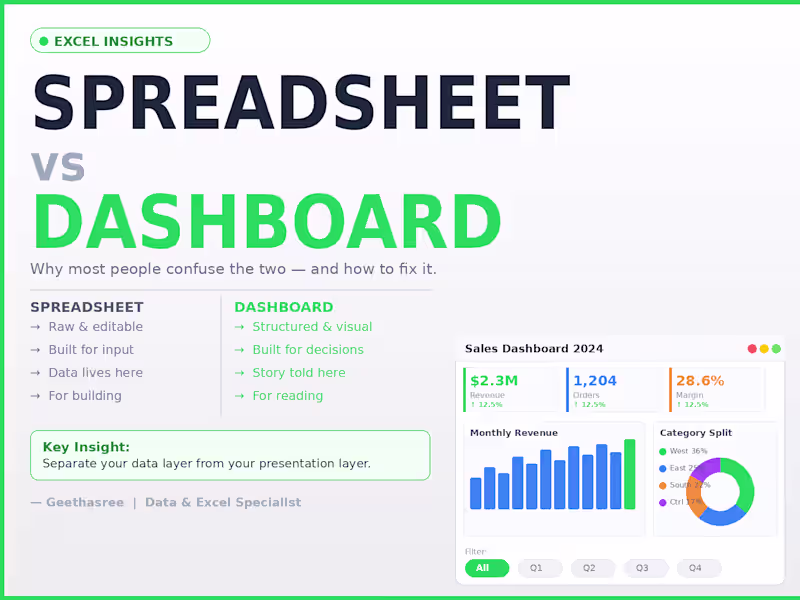
Most people think a spreadsheet and a dashboard are the same thing. They're not. A spreadsheet is where data lives. A dashboard is where decisions happen. The difference: Spreadsheet → raw, editable, flexible, built for input Dashboard → structured, visual, built for reading and decisions The mistake I see most often: People try to do both in the same sheet. The result? Decision makers see too much raw data Numbers get accidentally edited No one knows what to trust The fix is simple: Keep your data layer and your presentation layer separate. Raw data in one sheet. Dashboard in another. One is for building. One is for reading. When you separate them, updates become clean, mistakes become rare, and your reports actually get used. A spreadsheet stores your data. A dashboard tells its story.
2
3
67
Explore projects