Results that are similar to your search
Similar results



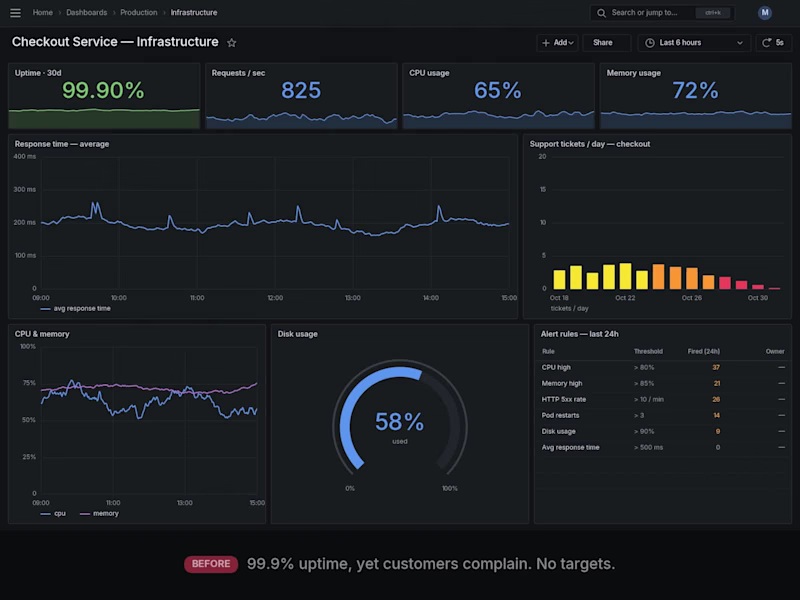
Many teams track CPU, memory and uptime, but nobody knows what “good” means. There are no targets, no error budget, and alerts fire without an owner. Customers feel the pain before the dashboard does.
What I do
In one week I define how reliable your service should be, and set up the targets and alerts to prove it.
What you get
3–5 SLIs and SLOs based on your real user journeys (availability, latency, error-free requests)
An error-budget policy: what happens when the budget runs low
Burn-rate alert rules, with clear “page” vs “ticket” thresholds
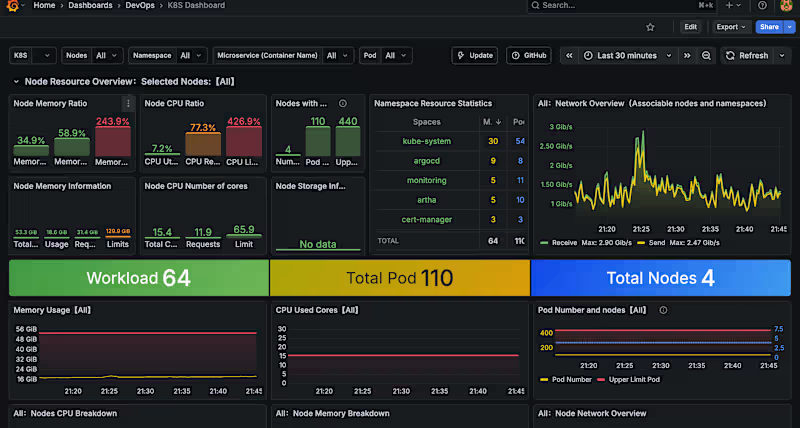
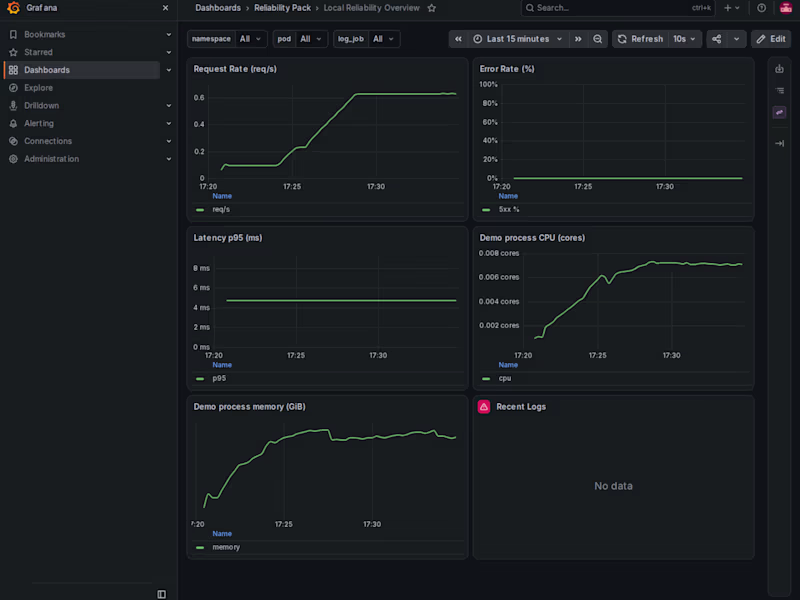
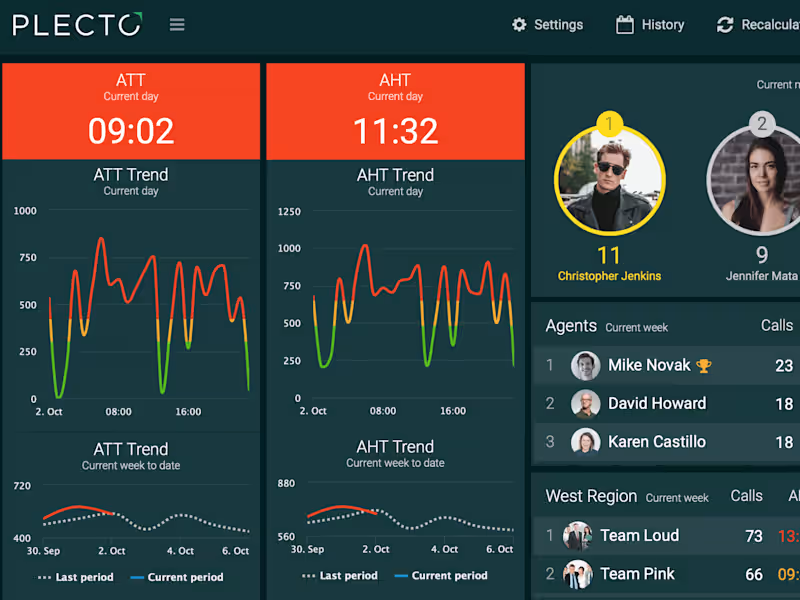
A dashboard design with SLO status, budget burn-down and a summary table
A short handover document and a 30-minute walkthrough call
How it works
Day 1: a short call about your service and users
Days 2–3: I draft the SLIs and SLOs
Days 4–5: alert rules, dashboard design and handover
Good fit if you
Run a production web or API service
Get alerts but still feel blind
Want SRE practices without hiring a full-time SRE
0
28