Data Visualization Projects in Türkiye
Data Visualization Projects in Türkiye
Sign Up
Post a job
Sign Up
Log In
Filters
2
Projects
People
Message
0
Interfacer .co
max
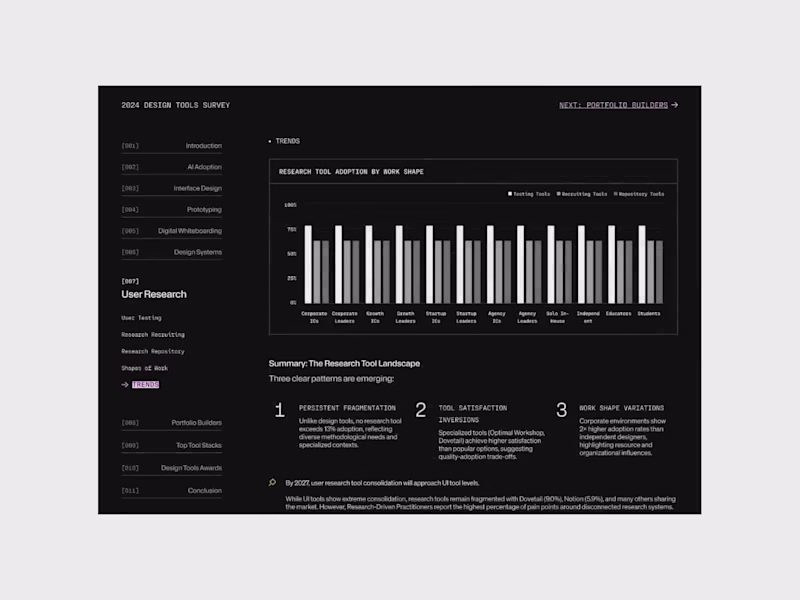
2024 Design tool survey
0
2.1K
Message
0
Gülçin Gümüş
pro
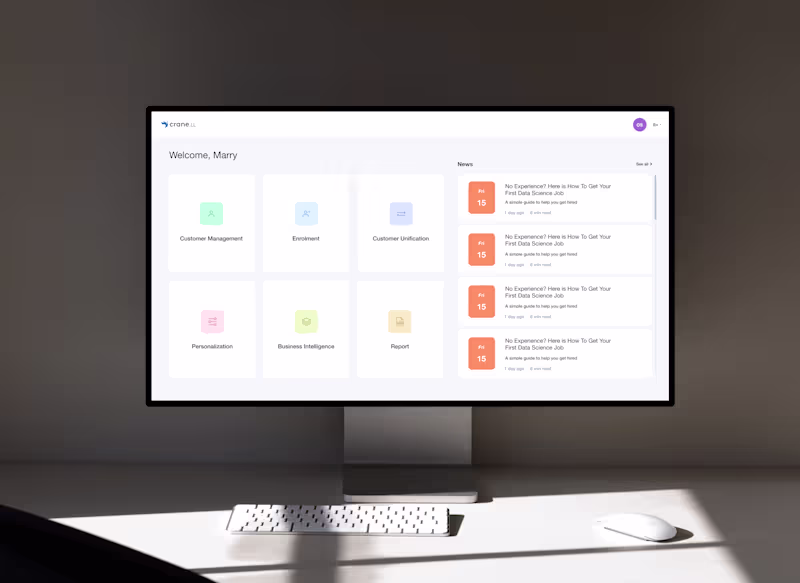
Crane Innovative UX Dashboard Pro
0
4
Message
4
Fatih Alkan
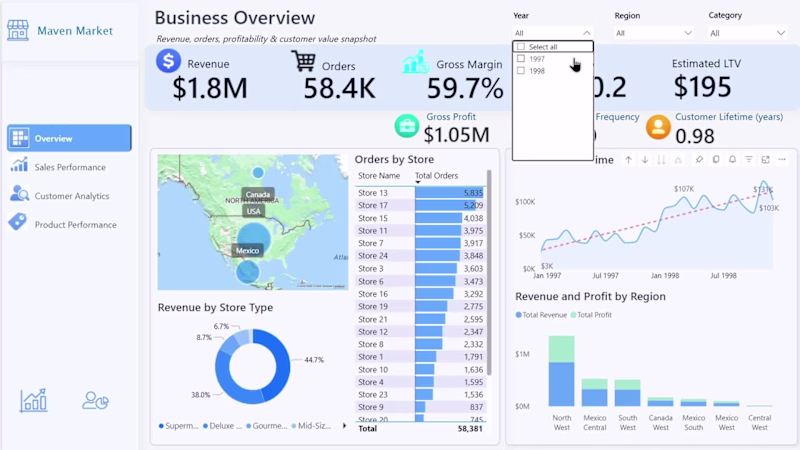
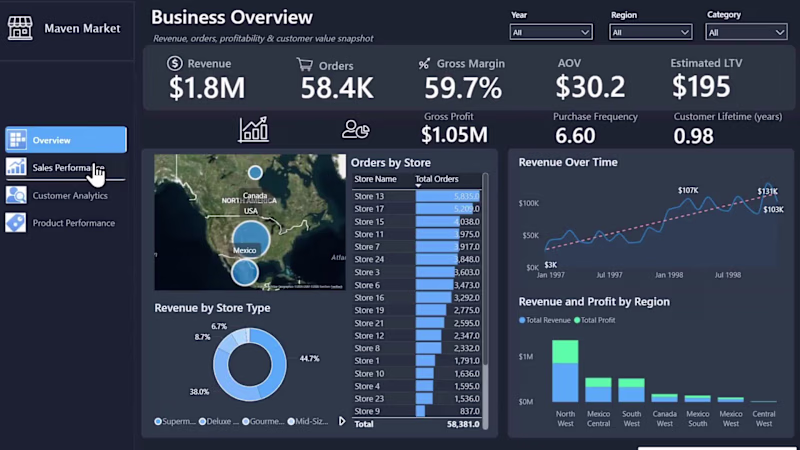
Power BI Sales Analytics Dashboard (4 pages) 🔗 Live Preview: View the interactive dashboard before purchase https://app.powerbi.com/view?r=eyJrIjoiYjcwNWE2OWYtM2ViZi00NDc5LTlmMTgtZWMzN2IxN2JkYTY1IiwidCI6IjYyZTI4NmIzLWE4ZDMtNDFkYS04Y2E4LWUwNzFhZTMxZGUwMiIsImMiOjl9&pageName=cd07523f864688ce9c1b Sale on Contra https://contra.com/products/gOrTVHYk-power-bi-sales-dashboard-or-editable-sales-analytics-template Designed to help you analyze revenue, sales performance, customer behavior, and product insights in one professional report. This editable template includes 4 interactive pages with modern visuals, KPI tracking, and dynamic filtering. ✨ What makes this dashboard special? • Clean and professional design suitable for any business • Fully editable Power BI (.pbix) file included • 4 ready-to-use pages: Business Overview, Sales Performance, Customer Analytics, Product Performance • Interactive filters and drill-down capabilities • Sample dataset included for easy customization • Perfect for portfolio, business analysis, or client reporting
1
4
279
Message
0
caner umar
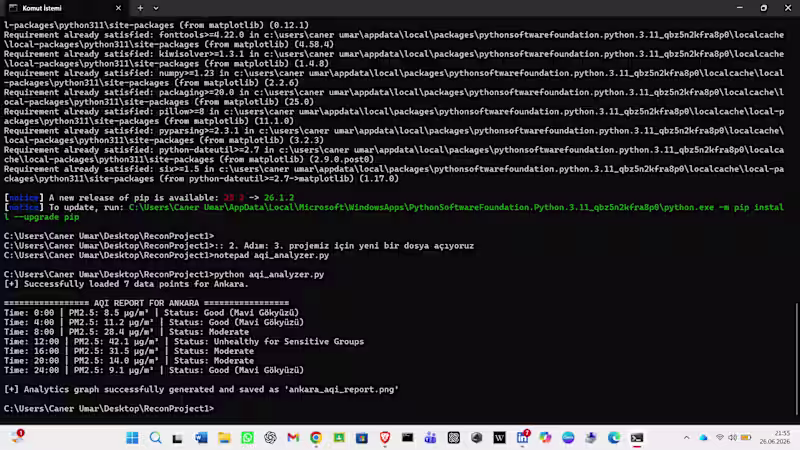
Engineered a Python-based data analytics solution designed to parse, process, and visualize environmental sensor telemetry data for urban air quality monitoring. Key Technical Achievements: Built a robust data pipeline using Python's native JSON library to ingest complex multi-point time-series sensor logs seamlessly. Implemented a programmatic classification engine based on international air quality metrics to track PM2.5 concentrations in real-time. Automated the generation of visual intelligence assets using Matplotlib, outputting professional data trend charts for corporate environmental compliance reporting.
0
8
Message
0
Incifer Gulle
Infographic Designs for the Turkish Airlines Blog
0
1
Message
1
Uren Karakum
pro
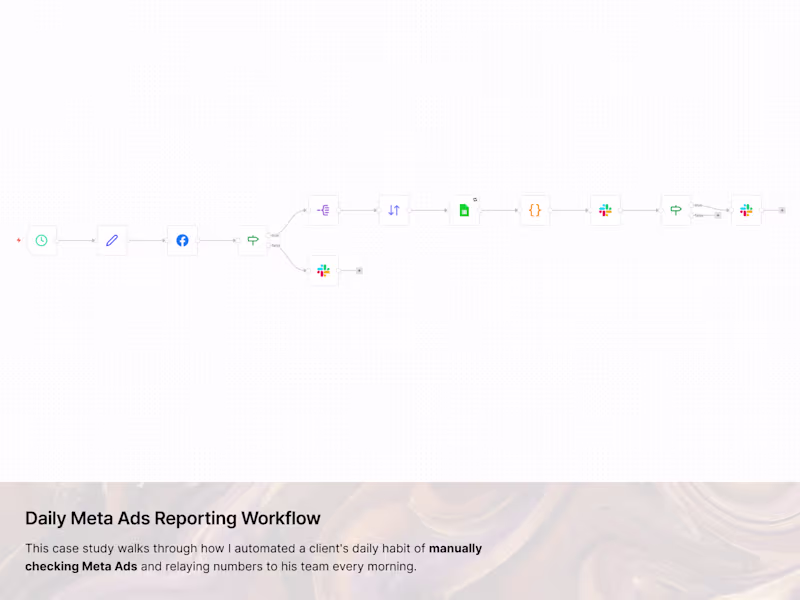
Daily Meta Ads Reporting Workflow
1
13
Message
1
Onder K.
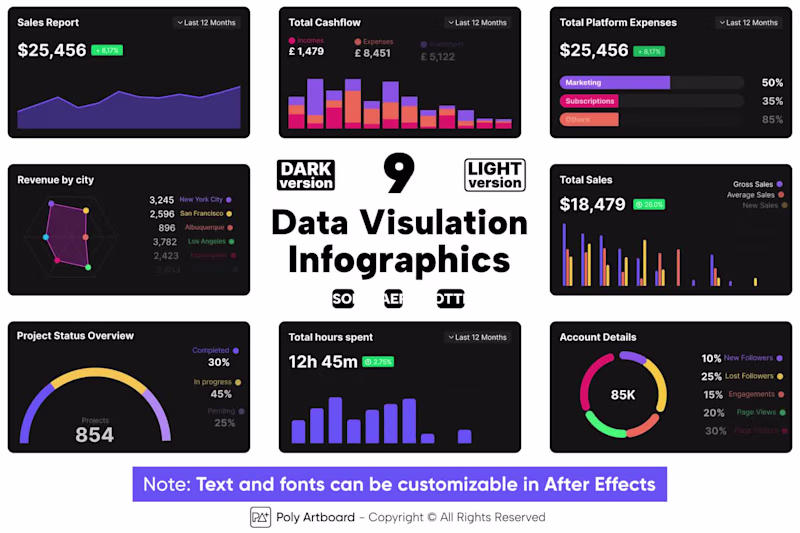
24 Data Visualization Infographics - LottieFiles x After Effects
1
1
Message
0
Gelen bedalen
Next-Gen Information Architecture: From Fintech to Digital Media 🚀 Engineering clarity out of complexity. 🧠💎 Whether it’s a high-stakes Fintech FP&A Dashboard or a cinematic Digital Magazine experience, my goal is to bridge the gap between technical power and visual elegance. ✅ Data Visualization: Turning raw numbers into actionable AI insights. ✅ Interactive Motion: High-fidelity animations that bring static pixels to life. ✅ SaaS Architecture: Clean, scalable, and conversion-focused layouts. From the Summoner's Rift to the Financial Markets—I build the interfaces of tomorrow. 🛠️✨ #DesignEngineering #FintechUI #Gelenbedalen #SaaSDesign #Framer
0
244
Message
0
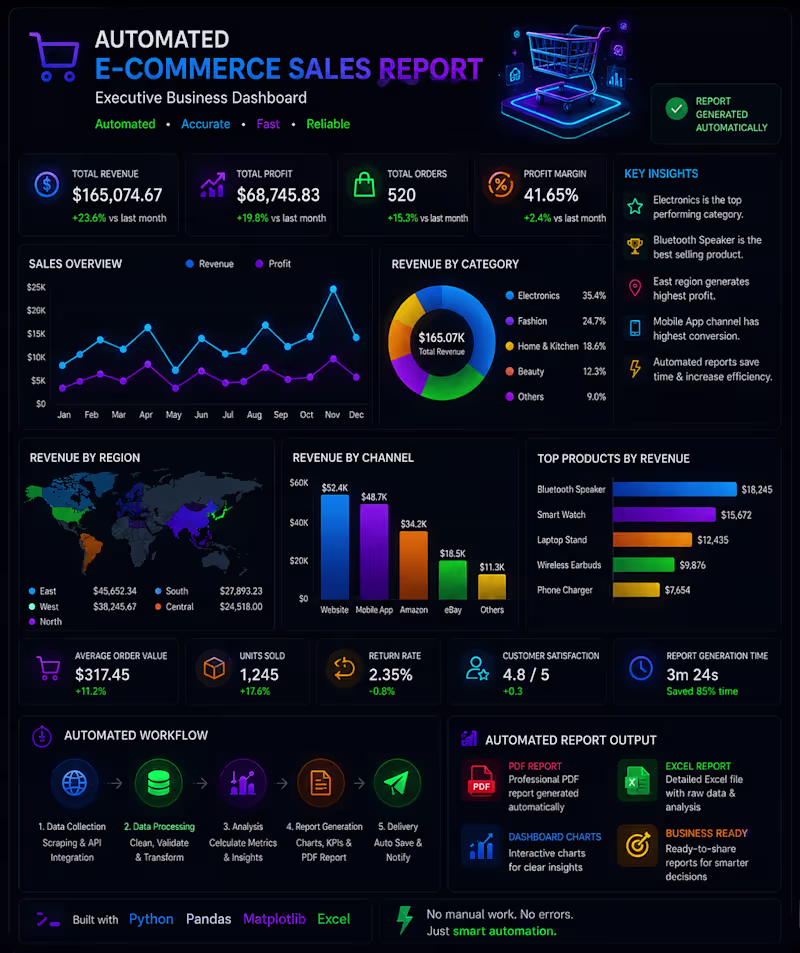
JG Automation & Data
Developed an automated e-commerce analytics dashboard using Python and data visualization tools. The system analyzes sales performance, revenue trends, product statistics, and customer behavior to generate interactive dashboards and automated reports for faster business insights.
0
72
Message
0
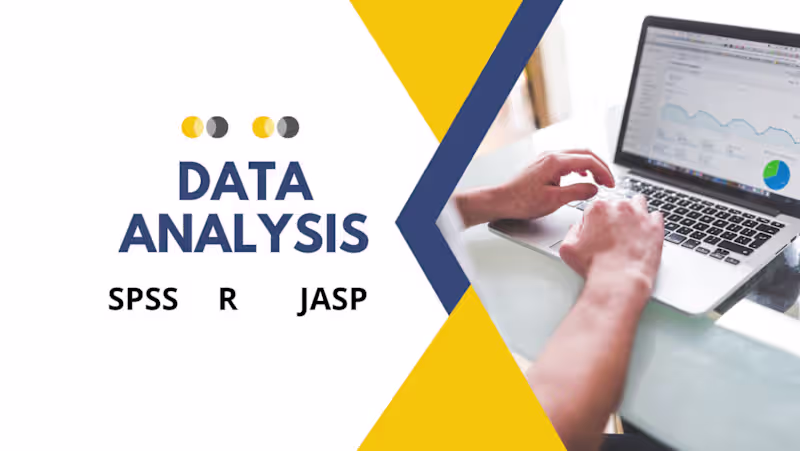
A2I Automation 2 Integration Lab
Do data analysis with Spss or R or Jasp and provide report
0
2
Message
0
Alin Yalcinkaya
Femicides in 2020 on Behance
0
20
Message
1
AKLILU ABRHAM ROBA
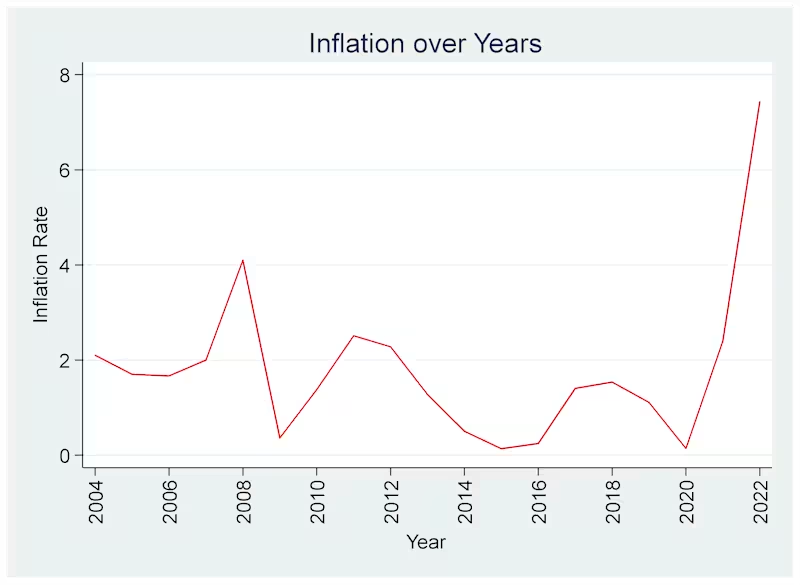
Project Title: European Corporate Growth Analysis (STATA) 📈 The Work: A deep-dive analysis of 1,734 data points across Europe (2004–2022). I used Robust Linear Regression to test the impact of Inflation, GDP, and ECB Interest Rates on company growth. Key Deliverables: 6-Stage Regression Analysis: Moving from baseline controls to complex interaction terms. Data Cleaning & Testing: Managed issues of heteroskedasticity and multicollinearity to ensure "trustworthy" estimates. Visual Trend Analytics: Created high-clarity time-series graphs tracking Inflation, Debt, and GDP Growth through three major global economic cycles. Tools Used: STATA 16, Excel, Econometric Modeling.
1
37
Message
0
Rana Akkuş
Schafer Home Appliance Key Visuals
0
0
Message
0
Gülçin Gümüş
pro
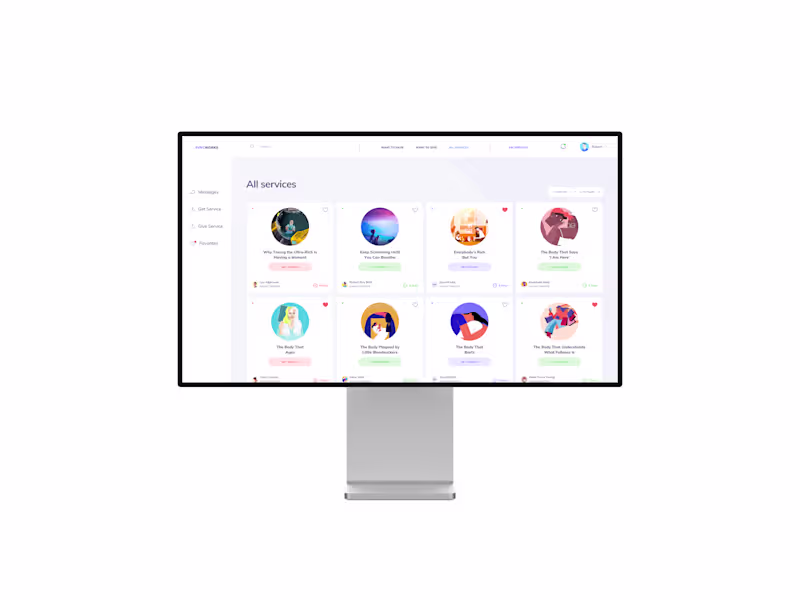
SyncWorks Dashboard
0
6
Message
2
Fatih Alkan
Power BI Sales Analytics Dashboard Template Designed to help you analyze revenue, sales performance, customer behavior, and product insights in one professional report. This editable template includes 4 interactive pages with modern visuals, KPI tracking, and dynamic filtering. Sale on https://contra.com/products/LiiSClYA-sales-analytics-power-bi-dashboard-report (🔗 Live Preview) ✨ Why it is special? • Clean and professional design suitable for any business • Fully editable Power BI (.pbix) file included • 4 ready-to-use pages • Sample dataset included for easy customization • Perfect for portfolio, business analysis, or client reporting
1
2
343
Message
4
Fatih Alkan
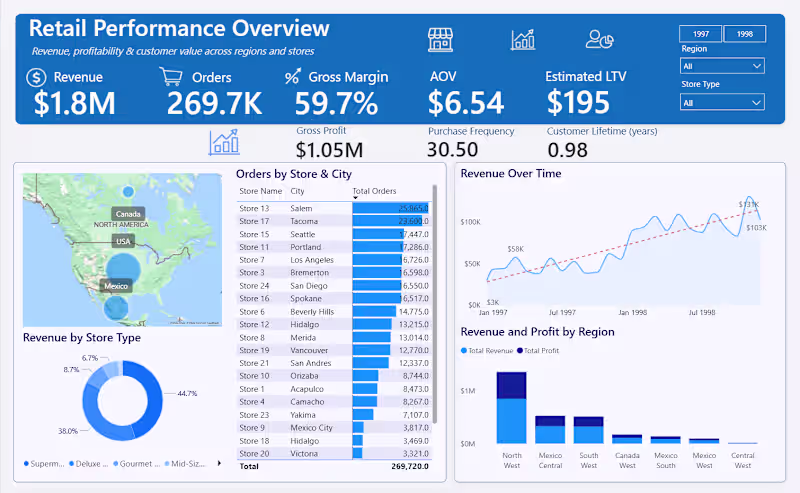
Retail Revenue & Customer Insights Dashboard (Power BI) This Power BI dashboard provides a comprehensive view of retail performance, combining revenue, orders, margin, and customer value metrics in a single executive-ready report. It enables stakeholders to track sales trends over time, analyze regional performance, and understand customer behavior through KPIs such as AOV, purchase frequency, and estimated lifetime value. The report is designed for fast decision-making, featuring automated filtering, geographic insights, and clean visual hierarchy suitable for leadership and operational teams. Built with scalable data modeling and designed to support automated refresh and alerting workflows.
4
416
Explore projects