Data Analysis Projects in Telangana
Data Analysis Projects in Telangana
Sign Up
Post a job
Sign Up
Log In
Filters
2
Projects
People
Message
4
Geethasree Naguboina
pro
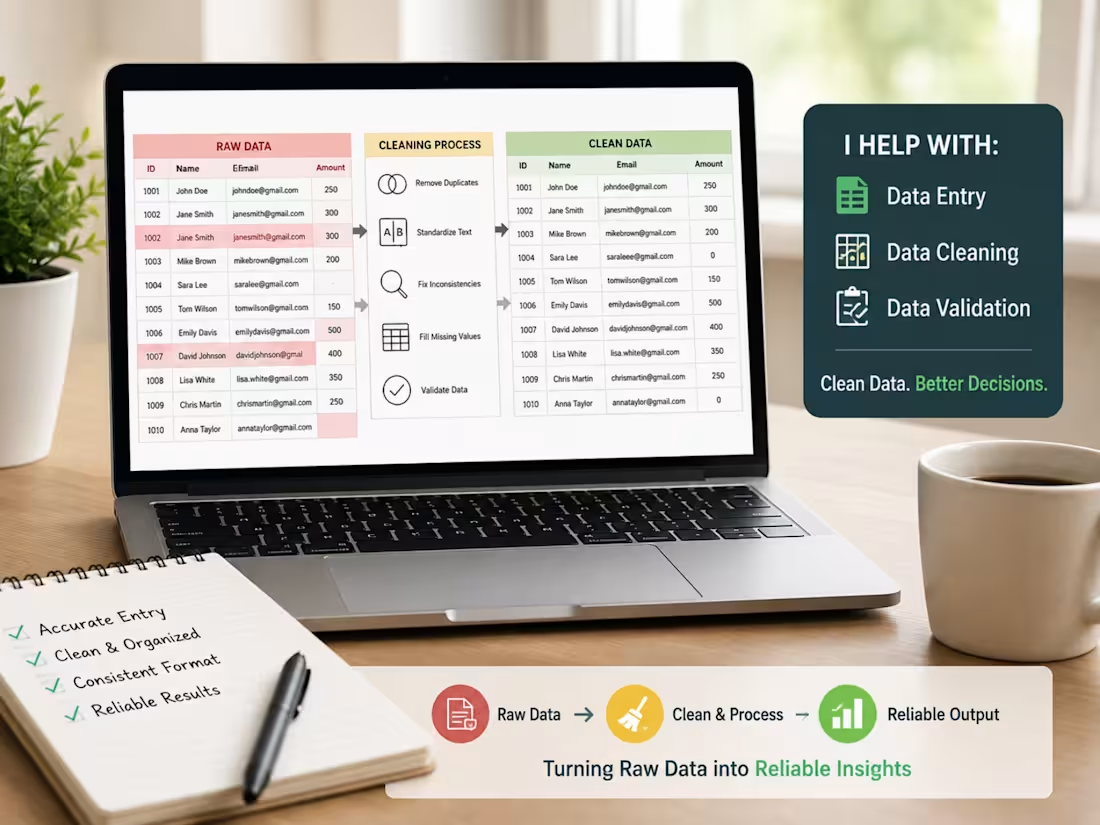
Clean Data. Better Decisions. Good data work starts with accuracy. I help organize, clean, and validate data so that spreadsheets and datasets are easier to use and trust. From data entry and formatting to identifying duplicates and inconsistencies, I focus on keeping every detail clear and consistent. Accuracy → Consistency → Reliable data.
4
4
783
Message
0
Rajaraman Arumugam
pro
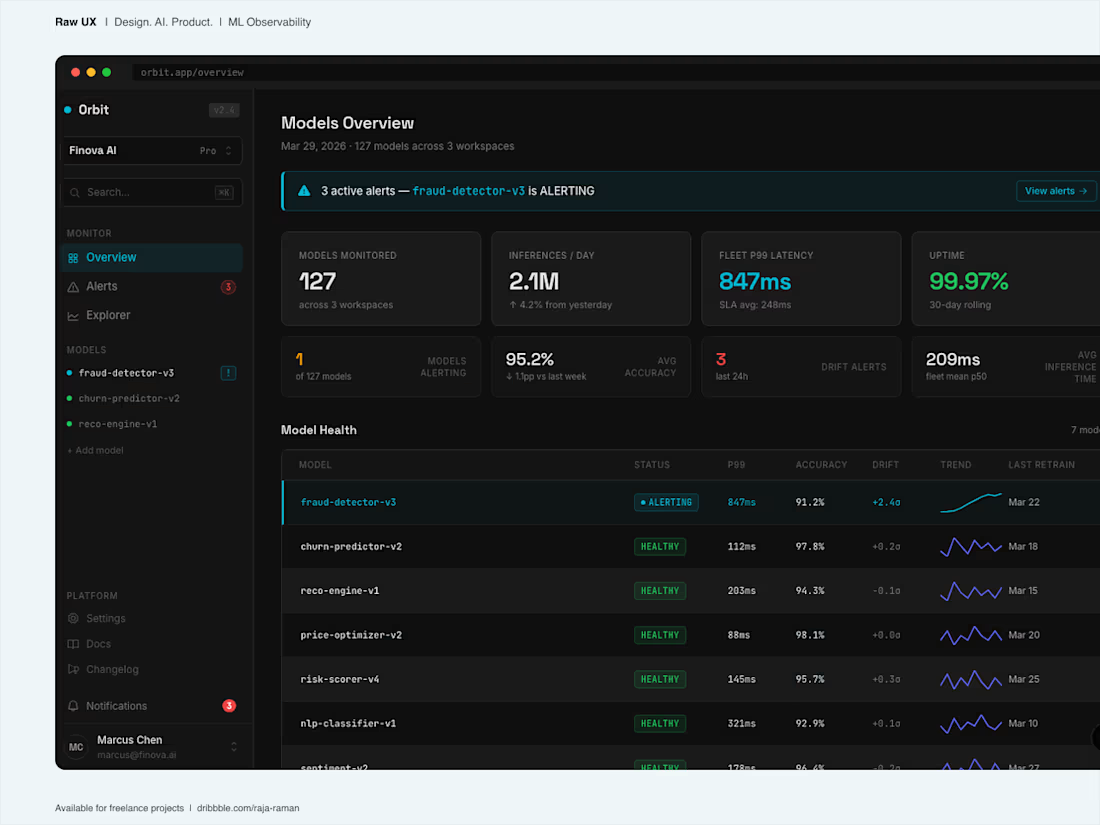
Orbit | ML model monitoring dashboard | Dark UI
0
5
Message
0
Krishna Chaitanya Mukundala
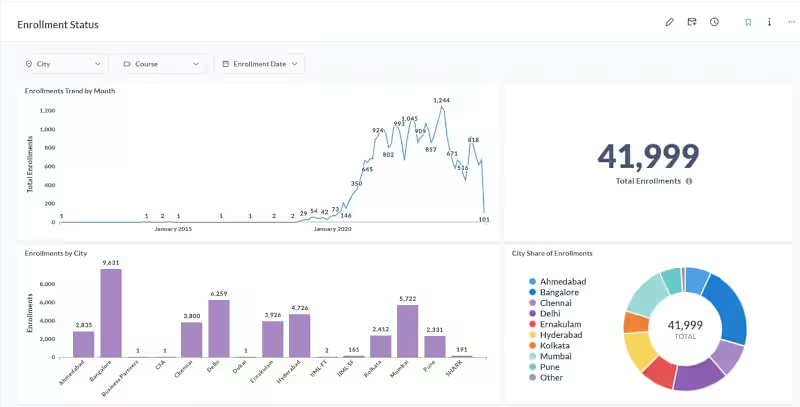
Metabase Dashboards for Edtech
0
21
Message
0
Yugandhar Reddy
I Built a profit-and-loss bridge tracing FY29 revenue down through each cost layer (raw material, direct expenses, employee costs, admin costs) to EBITDA. The waterfall view makes it immediately clear which cost categories are compressing margin the most, rather than the client having to infer it from a flat P&L table.😊
0
67
Message
0
Rakesh Ranjan
Sales Channel Analysis
0
3
Message
0
FAROOQ HASAN
Insurance Cost Prediction
0
54
Message
1
Mujtaba Quadri
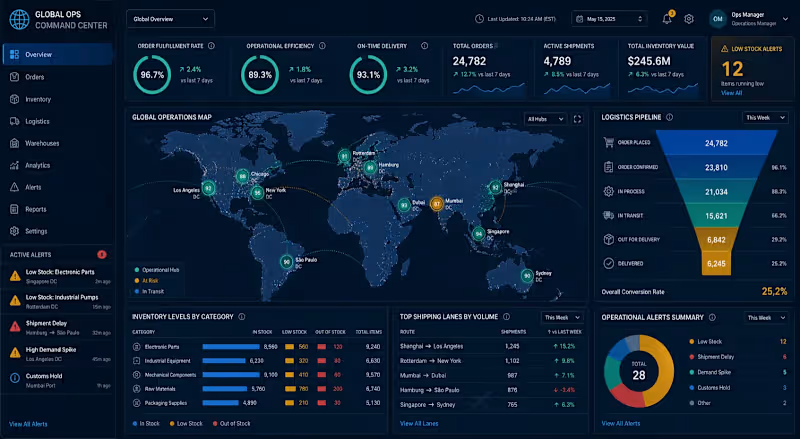
This Project Focused On The Architecture Of A Dynamic Operational Command Center Designed To Optimize Global Supply Chain Logistics And Inventory Management. By Integrating Multi-Source Data Streams Using Advanced SQL Querying, The System Provides Real-Time Visibility Into Key Performance Indicators Such As Order Fulfillment Latency, Inventory Turnover Ratios, And Regional Delivery Success Rates. Utilizing Sophisticated Data Visualization Techniques, The Dashboard Empowers Stakeholders To Identify Logistics Bottlenecks And Streamline Warehouse Operations. The Implementation Of Automated Trend Analysis Facilitated A Significant Reduction In Stock-Out Incidents And Enhanced Overall Operational Efficiency By Providing Granular Insights Into The End-To-End Supply Chain Lifecycle.
1
87
Message
0
Shaik Sohail
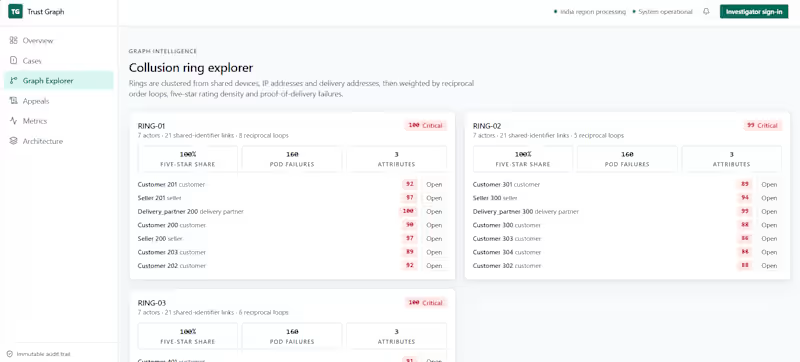
Fraud is a network. Score it like one. A per-transaction model sees one order at a time. Trust Graph links buyers, sellers, delivery partners, devices, IPs and addresses into one actor graph — then explains what it found in language a human reviewer and an accused seller can both act on.
0
23
Message
0
vijaykumar chilumuru
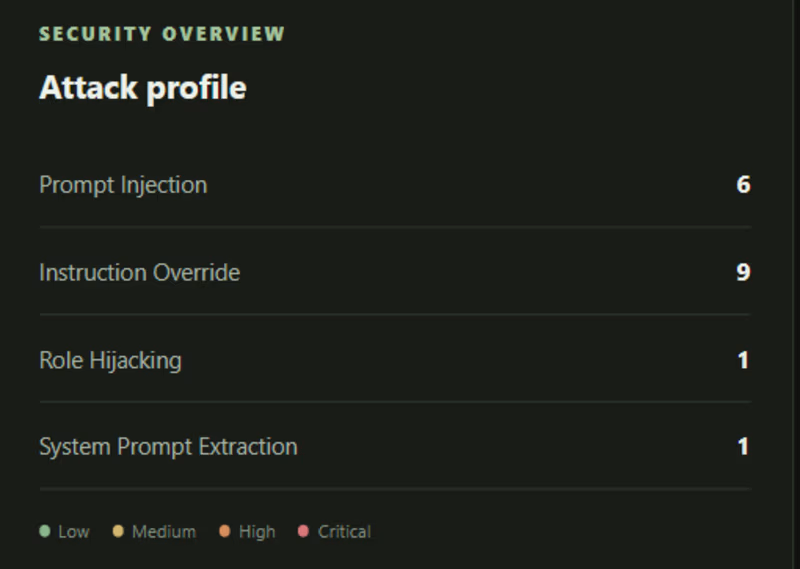
A prompt based injection attack on LLM
0
14
Message
0
Varshith Gaddam
Stock Analysis Project with AutoGen
0
8
Message
0
suresh bejawada
Management financial report (Microsoft Excel)
0
25
Message
0
KALYANA SREENIVASAN
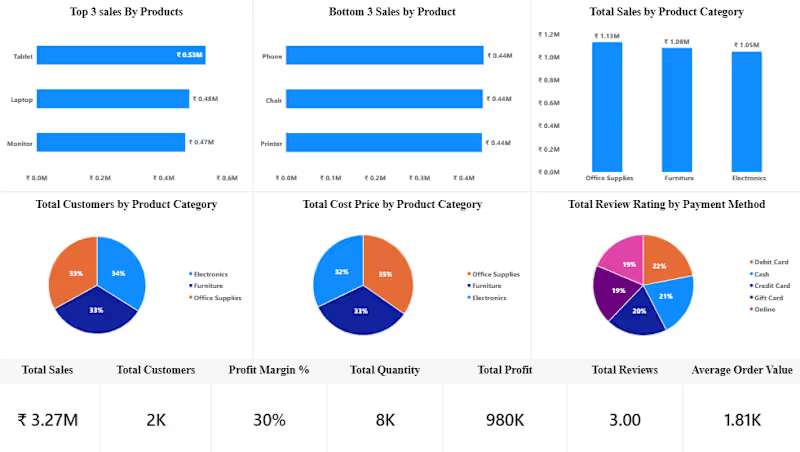
E-commerce Sales Analytics Dashboard - Power BI | ₹3.27M Revenue Tracking Client Problem: 2K customers, 8K orders in Excel. Owner had no idea which products actually make profit, which category drives customers. Dashboard Solution - 6 KPIs + 6 Visuals: Top 3 Sales: Tablet ₹0.53M | Laptop ₹0.48M | Monitor ₹0.47M Bottom 3 Sales: Phone, Chair, Printer - Clear underperformers to discount Sales by Category: Office Supplies ₹1.19M leads Furniture & Electronics Customer Mix: Electronics 34%, Office 33%, Furniture 33% - Balanced Cost Price by Category - 39% Office Supplies cost Review Rating by Payment: Credit Card 29% top, Debit 22% - Improve COD experience KPIs at Bottom: Total Sales ₹3.27M | Customers 2K | Margin 30% | Qty 8K | Profit 980K | AOV 1.81K | Rating 3.0 Impact: Client stopped pushing low-margin Phone/Chair, focused on Tablet/Office Supplies. Increased profit from 30% to 38% in 45 days Tools: Power BI, DAX, Sales Analytics For: E-commerce, Retail Stores, D2C Brands.
0
19
Message
0
SIVA SATYA PRASAD
Cleaned, managed, and analyzed complex datasets using advanced Excel and GIS tools to generate clear spatial insights and structured reports.
0
57
Message
0
adeel uzama
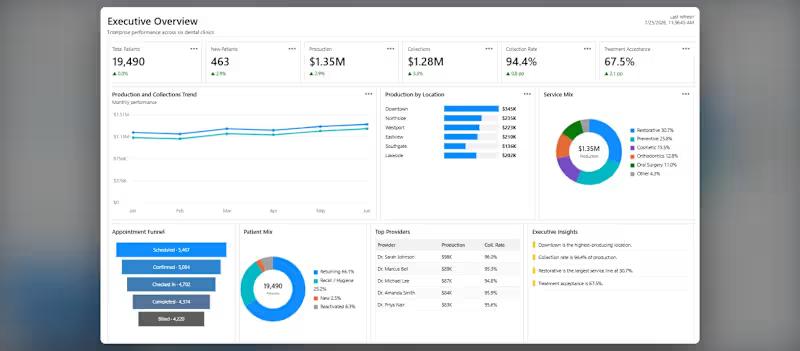
Multi-Location Dental Operations Intelligence Platform
0
2
Message
0
Yedla Naga Sathvik
Walmart Sales Data Analysis
0
6
Message
0
Gitesh Deshmukh
Big-Data-Ethereum-Analysis
0
3
Explore projects