



Hey, everyone!
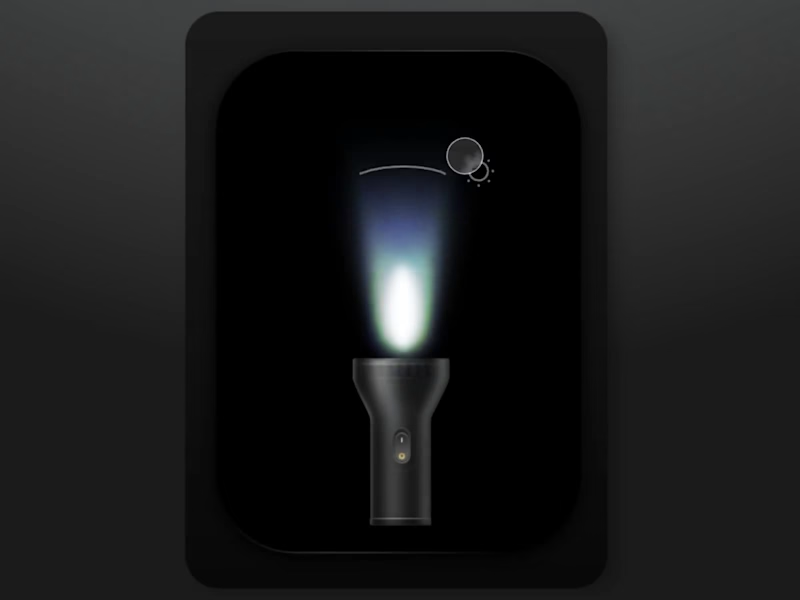
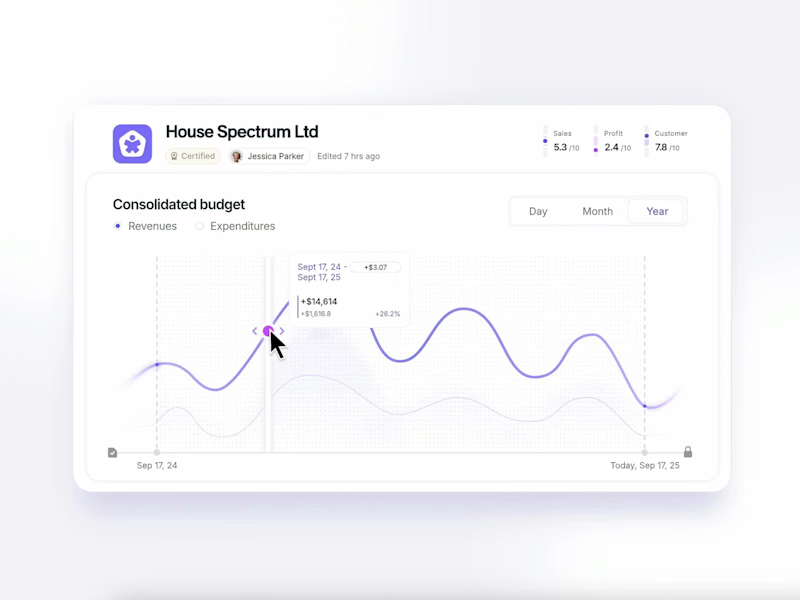
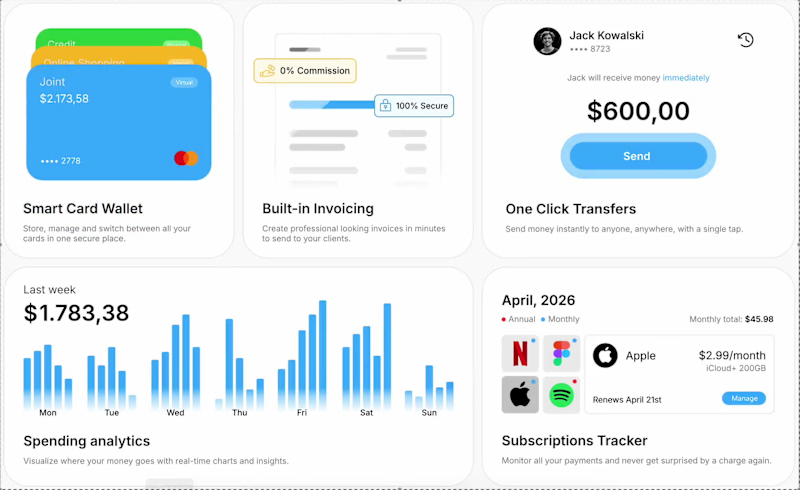
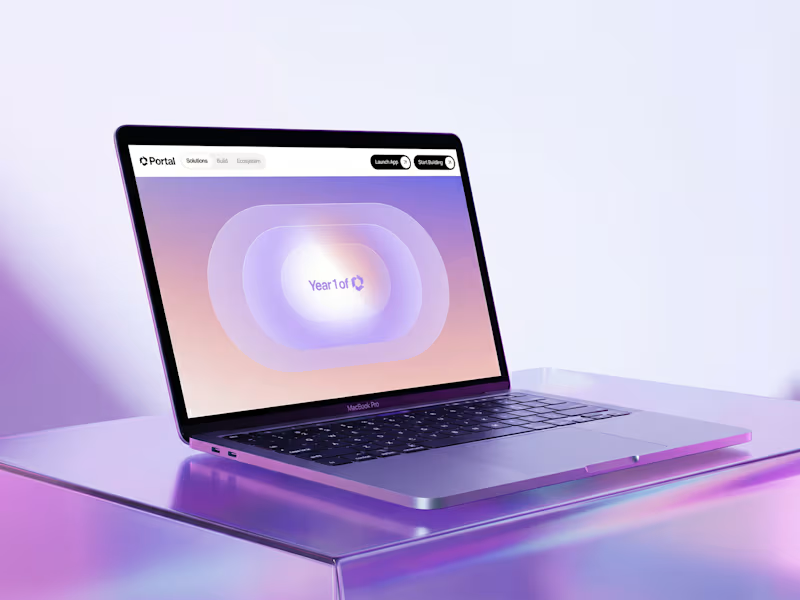
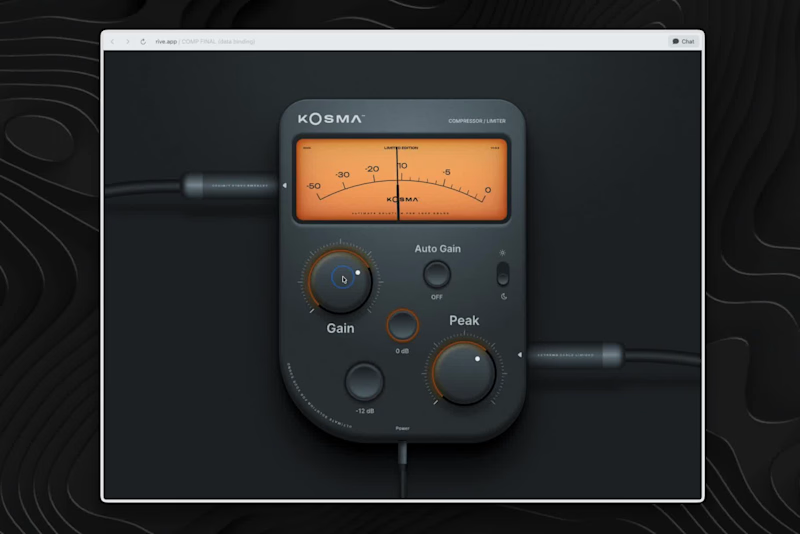
Here's my entry for the challenge - tiny audio compressor designed entirely in Rive.
I used data binding for the whole color palette, switching between light and dark mode using color interpolator (converter) to make these changes smooth and easy.
You can check this little toy here: https://rive.app/s/h39L0oBiokqLFfqeccMSOA/embed?runtime=rive-renderer
Turn your sond ON 🔇 ➡️ 🔈
40
127
2.5K
