Results that are similar to your search
Similar results
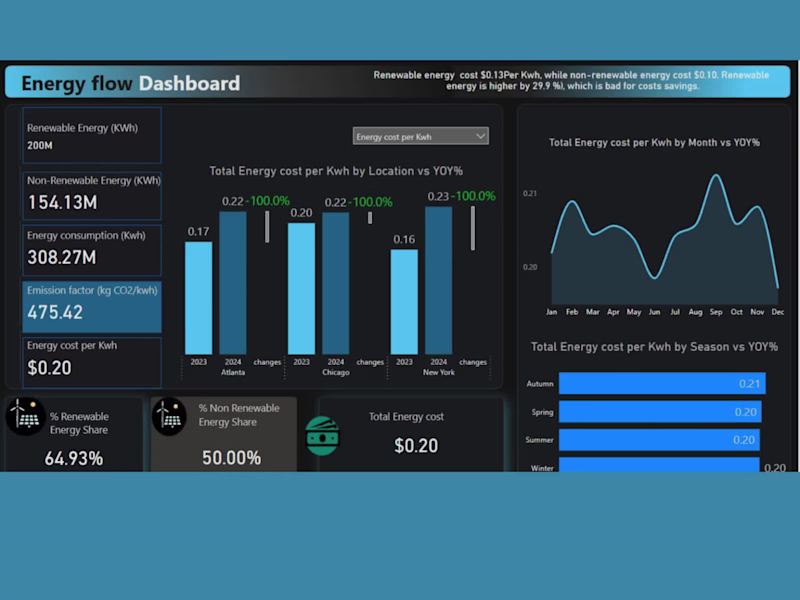
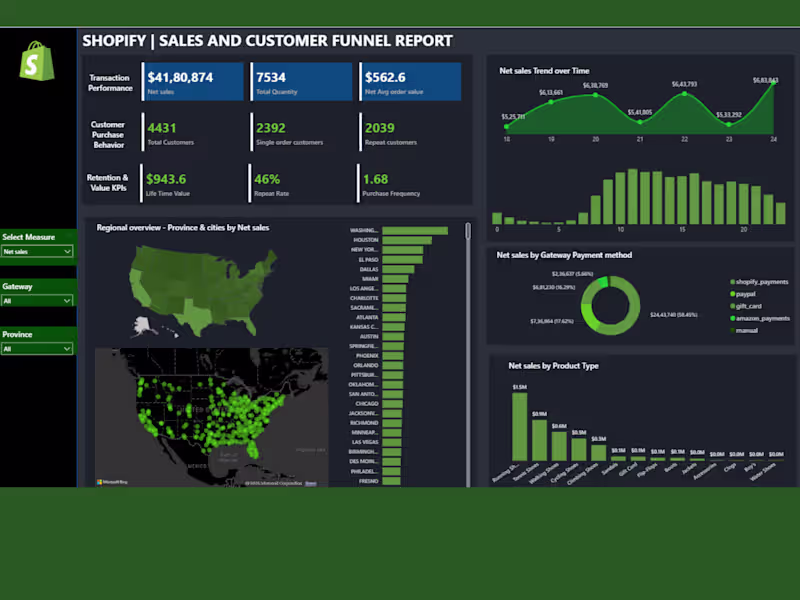
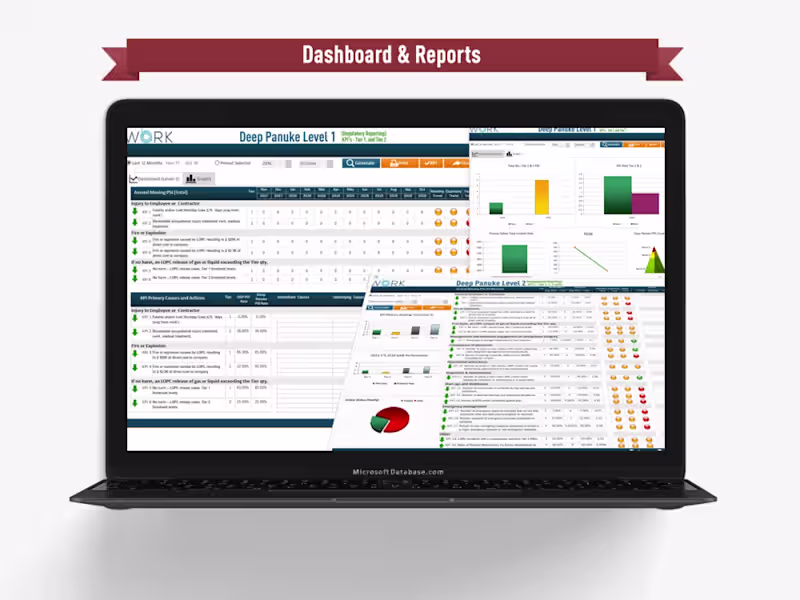
Business Intelligence Specialist | Power BI & Excel Expert
Business Intelligence Specialist | Power BI & Excel Expert

AI Automation & Business Systems Expert | Make.com, Zapier
AI Automation & Business Systems Expert | Make.com, Zapier


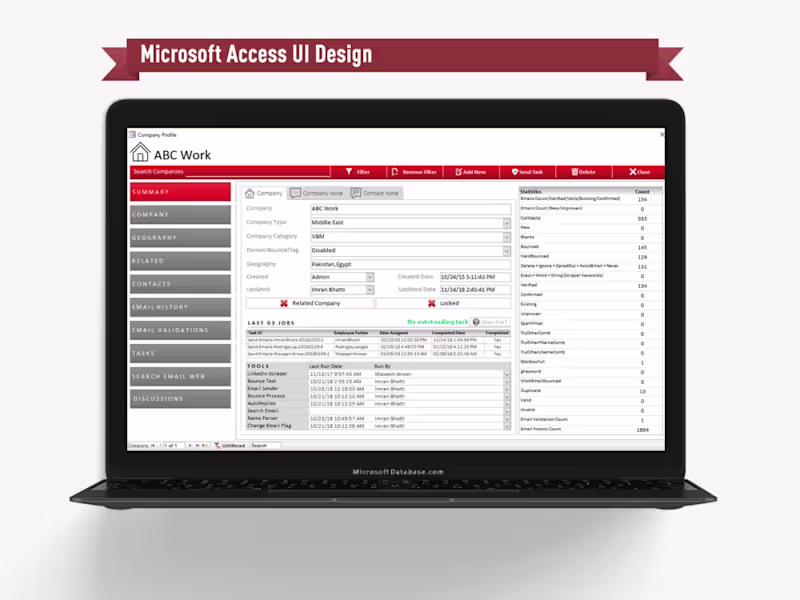
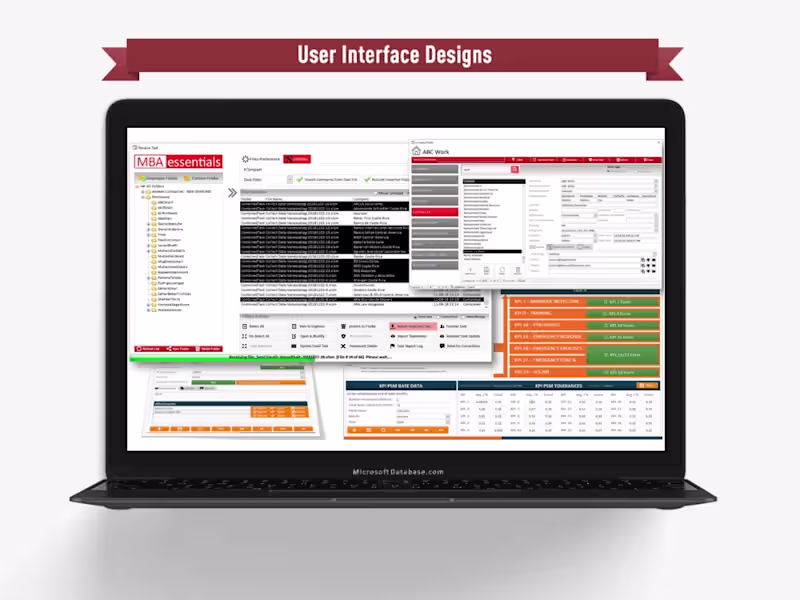
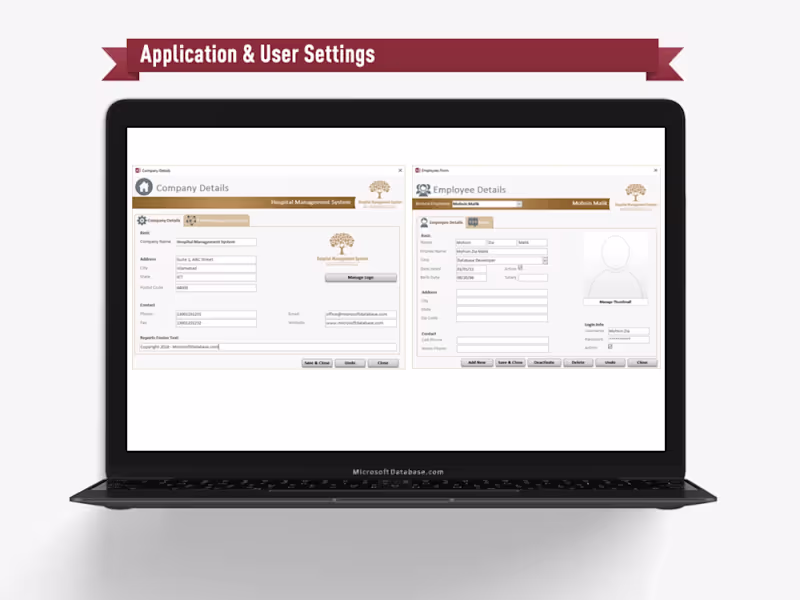
Microsoft Certified Database Engineer (Access/SQL)
- $10k+
- Earned
- 1x
- Hired
- 8
- Followers
Microsoft Certified Database Engineer (Access/SQL)
Customer care, problem solving and IT specialist.


Excel Specialist proficient in complex data modeling

Data entry specialist