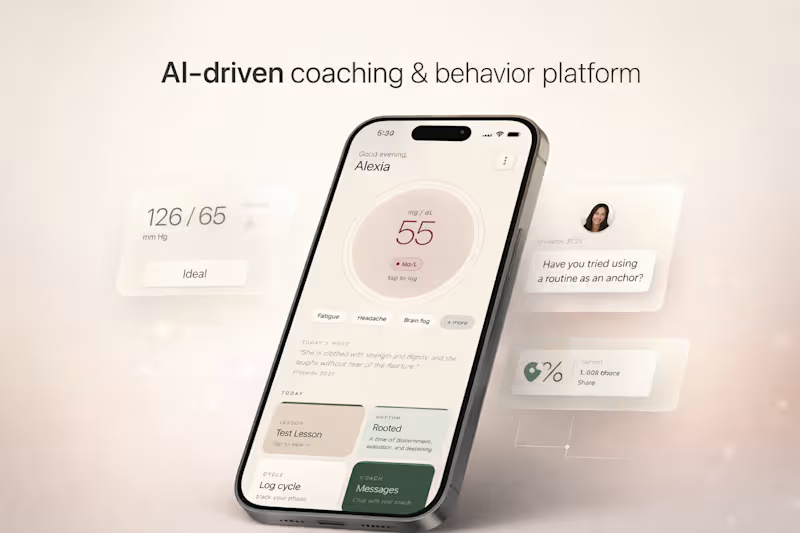
Projects using Python in PeoriaProjects using Python in PeoriaThis project is an AI-driven coaching and behavior platform designed around women’s physiological cycles, combining health tracking, guided routines, and structured coaching into a single system.
The product integrates glucose tracking and cycle-based fasting protocols, adapting recommendations based on different phases of a woman’s cycle. Instead of static tracking, the experience shifts contextually, guiding users through daily decisions, energy patterns, and habits in a way that feels aligned rather than restrictive.
A key part of the system is the coaching layer. The platform supports both 1:1 coaching and multi-week group programs, where users move through structured lesson plans, guided routines, and check-ins. The experience is designed to feel continuous, not fragmented, blending education, action, and reflection into one flow.
There is also a built-in spiritual component, where scripture and reflection prompts are integrated into the experience alongside behavioral guidance. This creates a more holistic system that supports not only physical health, but mental and emotional alignment.
From a product perspective, the focus was on designing a system that encourages consistency and long-term engagement. This includes adaptive feedback, clear progression, and interaction patterns that reinforce daily use without overwhelming the user.
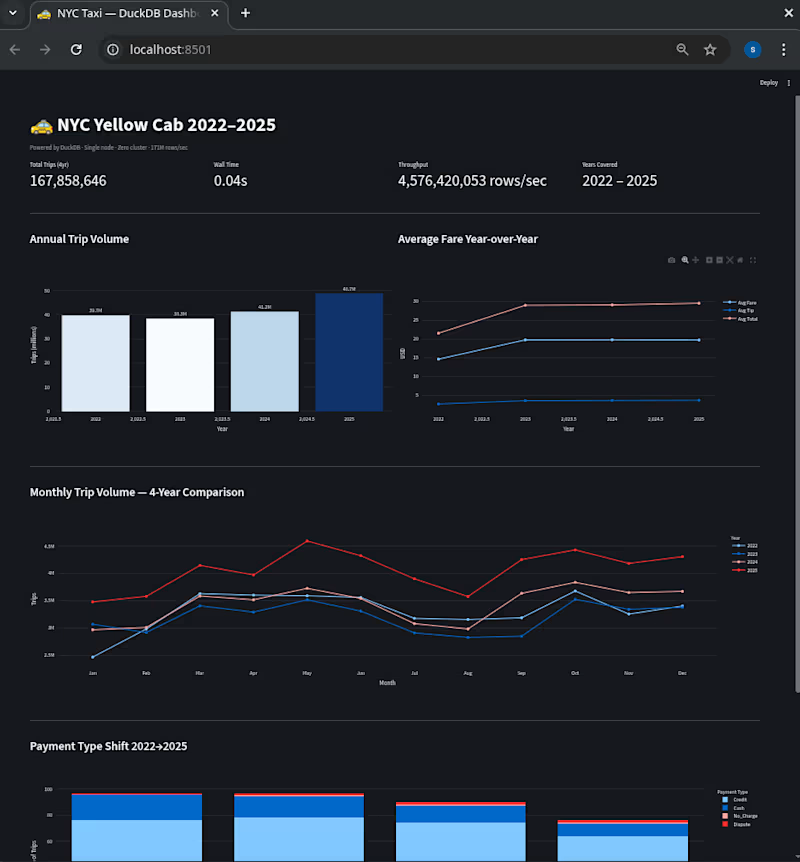
The result is not just a tracking tool, but a structured environment for behavior change, combining health data, coaching systems, and guided experiences into one cohesive platform. Interactive Streamlit dashboard backed by DuckDB — 167,858,646 NYC Yellow Cab records across 4 years (2022–2025),
48 Parquet files, queried live on a single workstation.
Features: KPI cards (total trips, fare revenue, YoY change), monthly trip volume line chart by year, payment type
shift analysis 2022→2025, interactive year/month filters. All queries run in DuckDB — no database server, no
cluster, no Spark.
This is the same data stack delivered to clients. Raw Parquet files in, live dashboard out — pipeline built once,
runs automatically.
Built with: DuckDB 1.4 · Python · Streamlit · Plotly · Pandas