The network for creativity
Join 1.25M professional creatives like you
Connect with clients, get discovered, and run your business 100% commission-free
Creatives on Contra have earned over $150M and we are just getting started
Back to feedPost
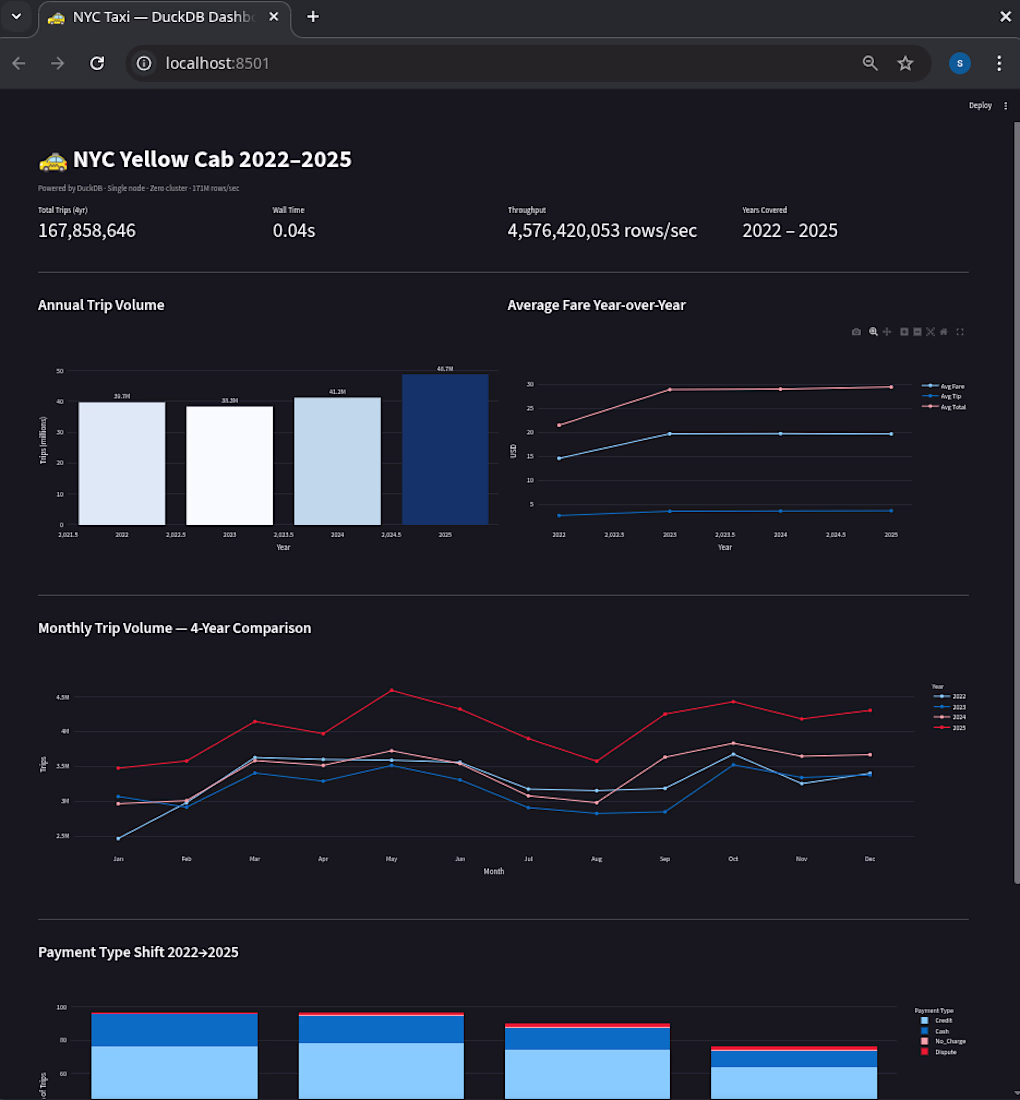
Interactive Streamlit dashboard backed by DuckDB — 167,858,646 NYC Yellow Cab records across 4 years (2022–2025),
48 Parquet files, queried live on a single workstation.
Features: KPI cards (total trips, fare revenue, YoY change), monthly trip volume line chart by year, payment type
shift analysis 2022→2025, interactive year/month filters. All queries run in DuckDB — no database server, no
cluster, no Spark.
This is the same data stack delivered to clients. Raw Parquet files in, live dashboard out — pipeline built once,
runs automatically.
Built with: DuckDB 1.4 · Python · Streamlit · Plotly · Pandas
The network for creativity
Join 1.25M professional creatives like you
Connect with clients, get discovered, and run your business 100% commission-free
Creatives on Contra have earned over $150M and we are just getting started
Related posts
SaaS Dashboard with real-time data visualization 📊
Built with Rive micro-interactions ✨
#wonderchallenge #rive #saas
clean and keen always win
RouteMind is a multi-tenant fleet management SaaS with live GPS tracking and an AI voice agent for operators. I built the full stack and the AI layer end to end.
The hardest part was the data architecture. Structured records like fleet profiles, driver data, and route history sit in MySQL. The high-frequency GPS event stream, which would choke a relational setup, runs through MongoDB instead. Vehicle positions render on a live map with latency low enough that movement feels real-time. That split is what kept the dashboard fast while thousands of GPS events landed every minute.
The AI layer is a voice agent built on a RAG pipeline and the OpenAI API. Operators call in, and the agent retrieves from a vector database of indexed fleet policies and route procedures before answering, never generic output. Questions outside its scope trigger a clean handoff to a human.
The platform is fully multi-tenant with strict data isolation between businesses. Roles and permissions are set from the dashboard, so onboarding a new operator needs no code change.
What the client gets: live fleet visibility, an AI agent that answers policy questions without tying up staff, and an architecture that holds up as the fleet grows.

Great work! my fyp was about Driver's behaviour analysis (dowsiness, distraction detection ) for fleet transportation system and generating alerts while danger is detected.
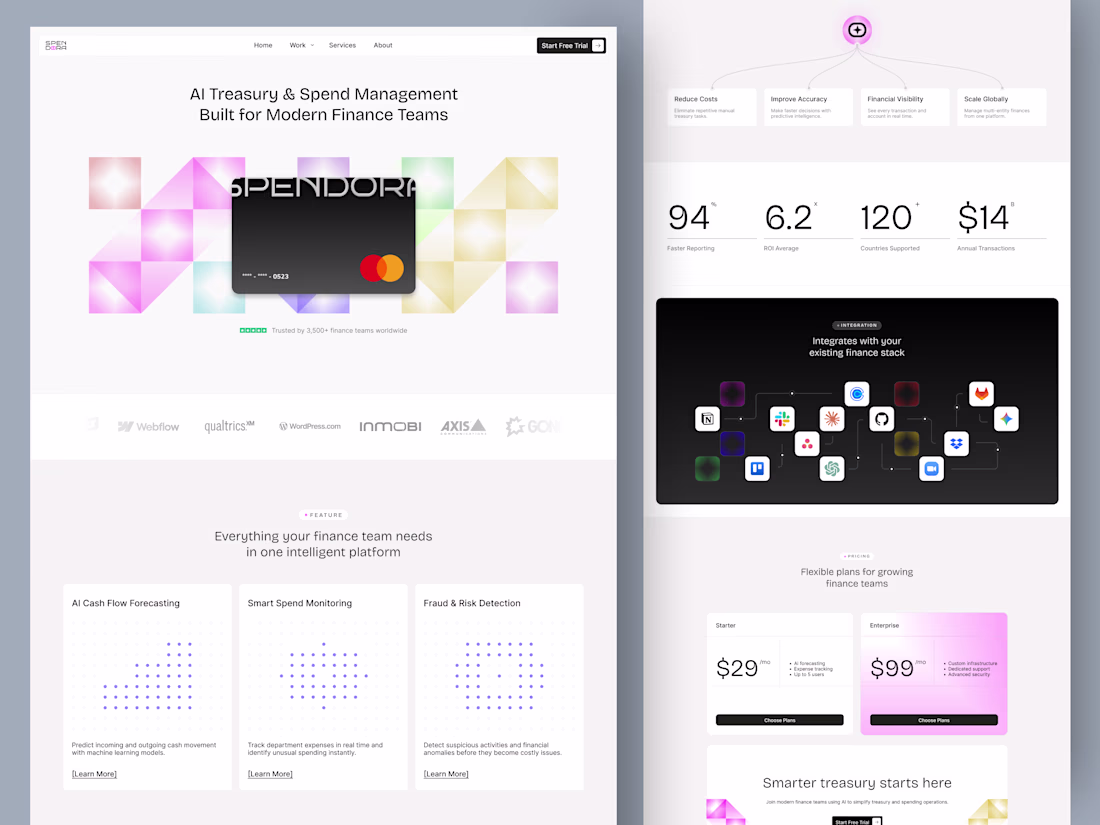
Introducing Spendora - A premium, next-gen AI treasury and spend management landing page experience designed to simplify complex financial data visualization through intuitive UI layouts.
Tell us your thoughts in the comments! 👀✨
📩 Collaborate with Us? Contra Odama Studio
Well done!
Trending
Claude
Claude has entered the design space. How are you using Claude Design?
Contra University
Learn from expert creatives how to earn more using next-gen AI tools.
fifaworldcup2026
The World Cup is here and the whole world's watching. How are you designing for the world stage?
creativeaiflow
Creative AI workflows are evolving. What tools do you use, and what are their strengths and weaknesses?
freelancerlife
Freelancer life is wins, pivots, and everything in between. What’s yours right now?