Projects using Microsoft Power BI in New Delhi
Projects using Microsoft Power BI in New Delhi
Sign Up
Post a job
Sign Up
Log In
Filters
2
Projects
People
Message
2
Ajay Bidyarthy- AI Full Stack Developer
pro
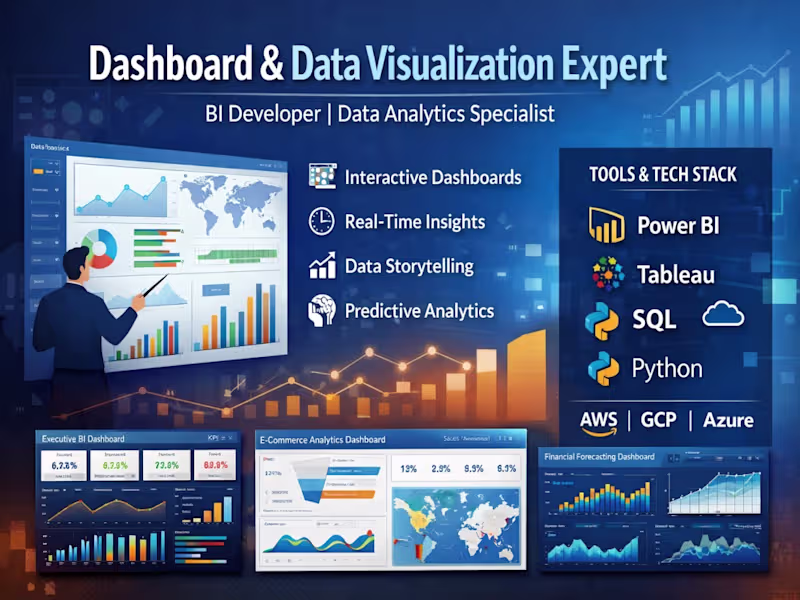
I specialize in transforming complex datasets into intuitive, visually compelling dashboards that drive strategic decision-making. With deep expertise in BI tools and data analytics, I design interactive, real-time reporting systems that help businesses uncover trends, monitor KPIs, and optimize performance. My approach combines data storytelling, clean UI/UX, and scalable architecture to deliver impactful insights. 🔹 My Project Portfolio: 📊 1. Executive Business Intelligence Dashboard Built a dynamic KPI dashboard for C-level executives Integrated multiple data sources (CRM, ERP, marketing platforms) Delivered real-time insights on revenue, growth, and performance Tools: Power BI, SQL, Azure 📈 2. E-commerce Analytics Dashboard Designed a dashboard tracking sales, customer behavior, and conversion rates Implemented cohort analysis and funnel visualization Improved marketing ROI tracking by 40% Tools: Tableau, Python, Google Analytics 📉 3. Financial Performance & Forecasting Dashboard Developed financial models and forecasting dashboards Visualized cash flow, P&L, and budget vs actuals Enabled data-driven financial planning Tools: Power BI, Excel, DAX 📍 4. Operations & Supply Chain Dashboard Created logistics tracking and inventory monitoring system Real-time alerts for stock levels and delays Reduced operational inefficiencies Tools: Looker Studio, BigQuery 📊 5. AI-Powered Analytics Dashboard Integrated machine learning predictions into dashboards Automated anomaly detection and trend analysis Delivered predictive insights for decision-making Tools: Python, TensorFlow, Streamlit
1
2
195
Message
2
Vikas Kashyap
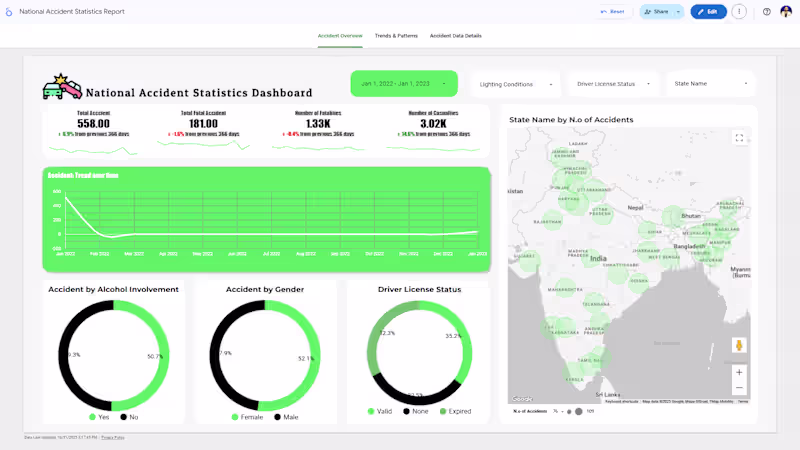
National Accident Statistics Dashboard in Google Looker Studio: I built an interactive Looker Studio dashboard using Google Sheets as the data source to visualize national accident statistics. The report analyzes accidents by region, time, severity, and demographics. A scheduled data re:fresh every 15 minutes keeps the dashboard updated in real time. As a Data Visualization Expert, I combined automation and design to deliver a clean, insightful, and dynamic Looker Studio dashboard for data-driven decision-making. 🎉 💯 🎉
2
146
Message
0
Aryan Gupta
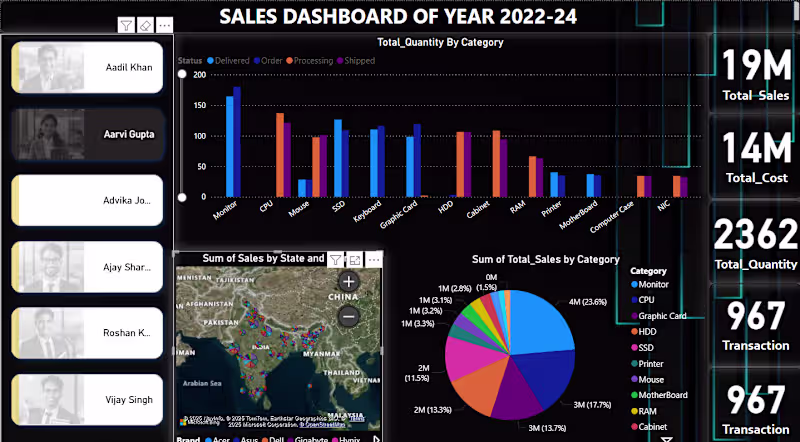
THIS IS MY NEW DATA ANALYTICS PROJECT WITH EMPLOYEE BASED SALES DASHBOARD
0
15
Message
0
Urvi Walia
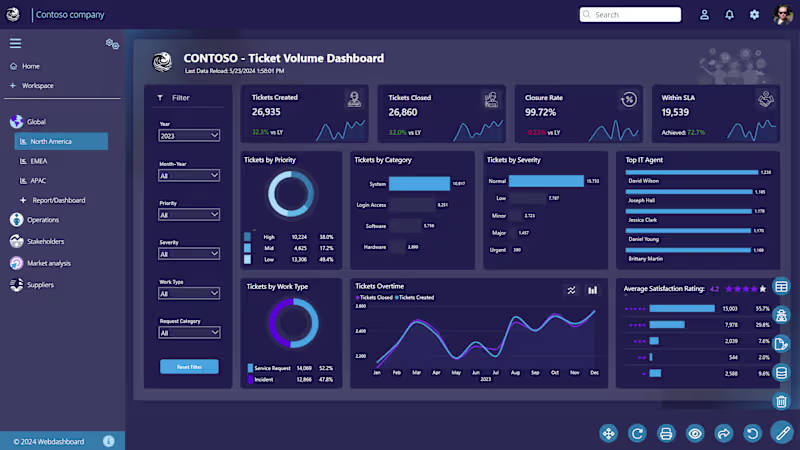
IT Service Management Dashboard Project Developed an interactive IT Service Management dashboard to monitor ticket volume, incident trends, SLA performance, and support team efficiency. Analyzed operational support data to identify service bottlenecks, improve response times, and support data-driven operational decisions. Key Business Insights & Decisions: Monitored ticket creation and closure trends to improve operational efficiency Identified high-priority and high-severity incidents requiring immediate attention Tracked SLA compliance rates to reduce delayed ticket resolutions Analyzed support categories and work types to optimize resource allocation Evaluated top-performing IT agents based on ticket resolution performance Improved service quality monitoring through customer satisfaction analysis Dashboard Highlights: Ticket Volume & Closure Tracking SLA Performance Monitoring Ticket Priority & Severity Analysis Support Category Breakdown IT Agent Performance Analysis Customer Satisfaction Metrics Interactive Filters for Dynamic Reporting Skills Used: Data Cleaning & Transformation Exploratory Data Analysis (EDA) KPI Monitoring & Reporting Operational Data Analysis Data Visualization Dashboard Development Business Intelligence Reporting Insight-Driven Decision Making Tools & Technologies: Power BI • Excel • SQL • Python • DAX • Data Visualization
0
14
Message
0
Aditya Tanwar
Coffee Shop Sales Analysis
0
32
Message
1
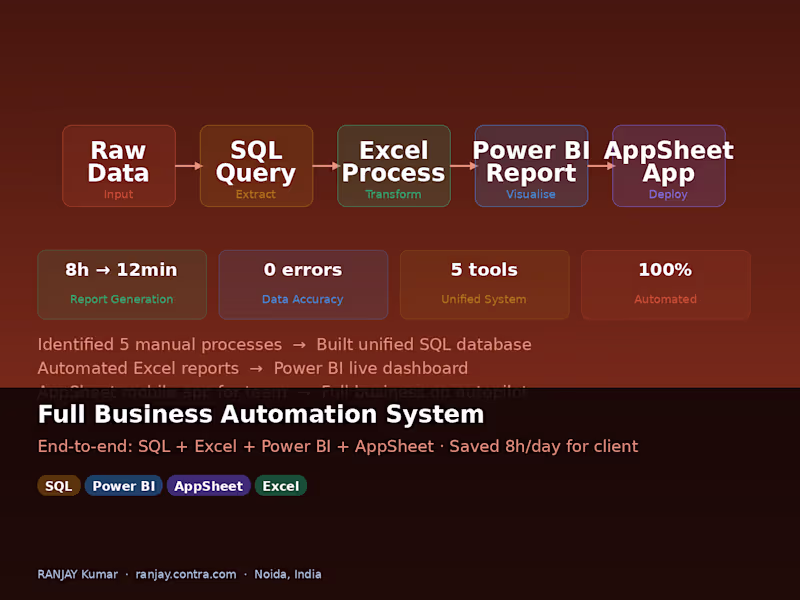
RANJAY Kumar
5 signs your business needs automation: 1️⃣ You copy-paste data between files daily 2️⃣ Your reports take more than 30 minutes to prepare 3️⃣ You've found errors in your spreadsheets more than once 4️⃣ You don't know your real-time sales or inventory right now 5️⃣ Your team does the same task more than 3 times a week If you said yes to even 2 of these — you're losing money to manual work. I fix this using: → SQL (connects and cleans your data) → Advanced Excel (automates your reports) → Power BI (shows everything in real time) → AppSheet (gives your team a mobile app) → Google Sheets (collaborates automatically) Starting from $69. No long contracts. Check my profile 👇 #businessautomation #dataanalyst #powerbi #excel #sql #freelancer #nocode #contra
1
96
Message
0
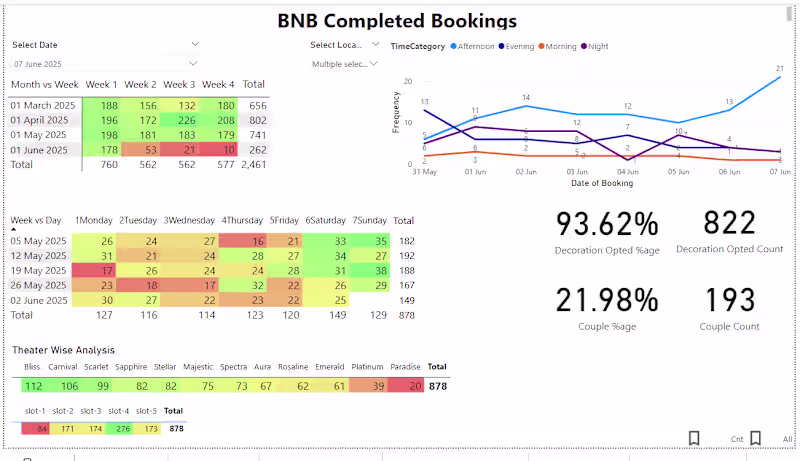
Madhur Goel
Power BI Dashboard for Binge and Bash
0
4
Message
1
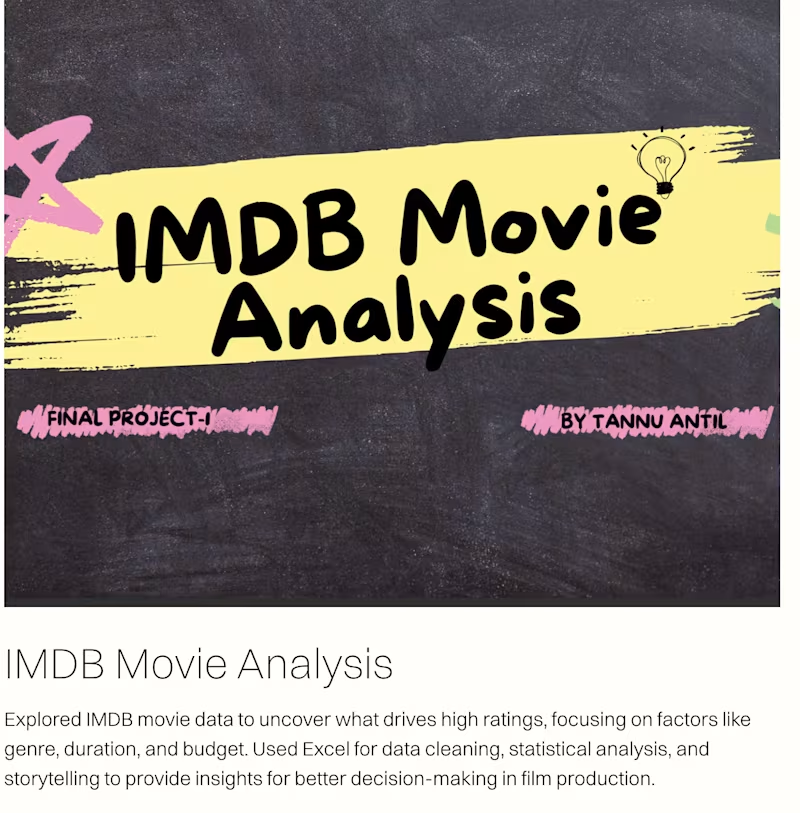
Tannu Antil
IMDB Movie Analysis Explored IMDB movie data to uncover what drives high ratings, focusing on factors like genre, duration, and budget. Used Excel for data cleaning, statistical analysis, and storytelling to provide insights for better decision-making in film production.
1
87
Message
0
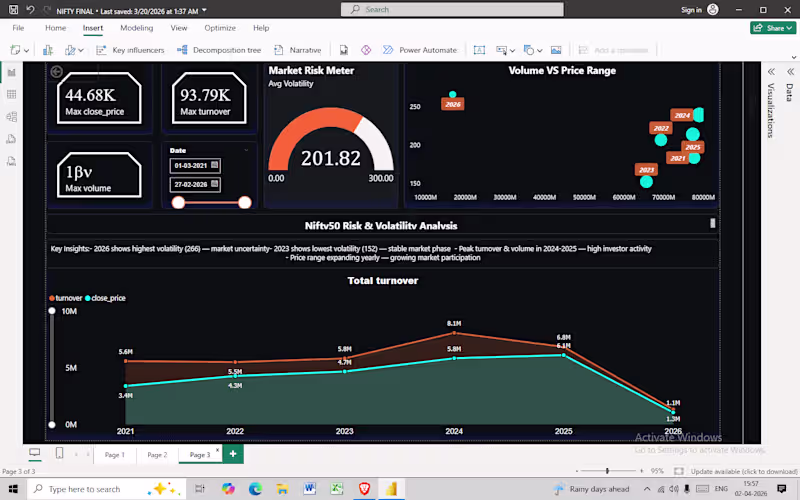
Saransh Purohit
Risk management analysis
0
12
Message
0
Samridhi Chatter
Coca-Cola: #SheTheDifference
0
3
Message
0
Nishita .
GitHub - Nishita76/Retail-Customer-Clustering
0
7
Message
0
Khushi Mehta
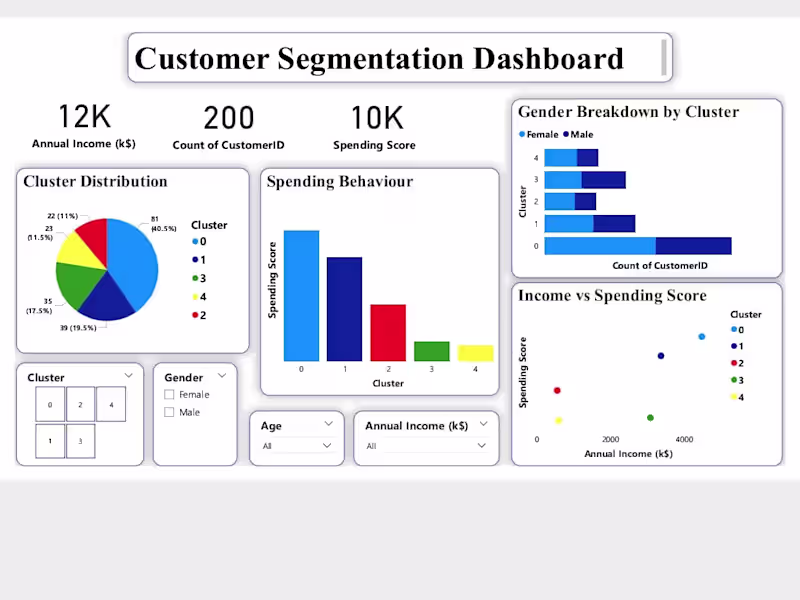
Customer and Sales Insights Dashboard
0
0
Message
0
Poonam Kashyap
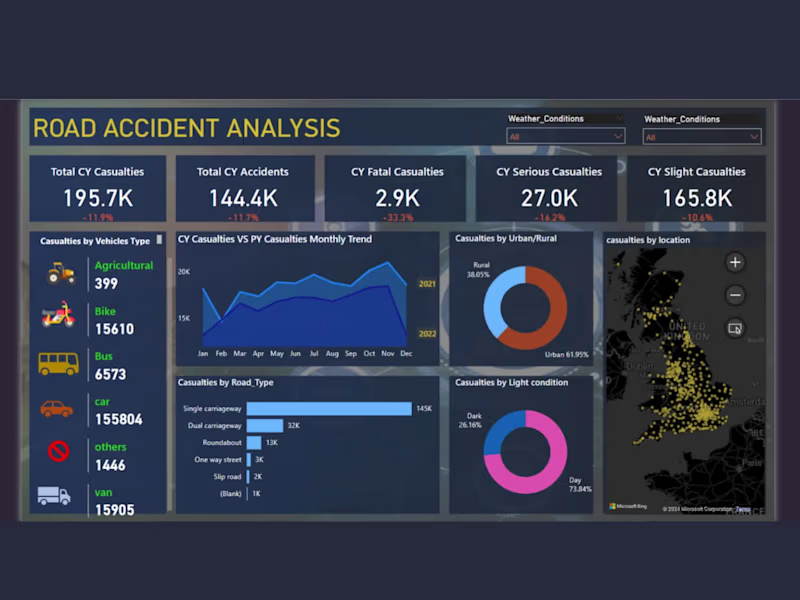
Road Accident Analysis Dashboard – Power BI Project
0
3
Message
0
Rahul Verma
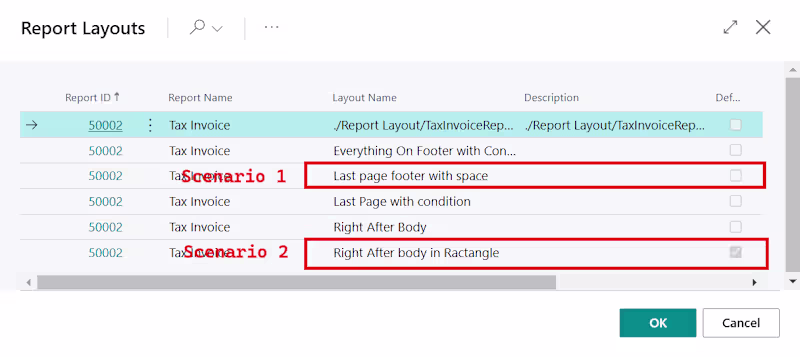
Tax Invoice Report
0
0
Message
0
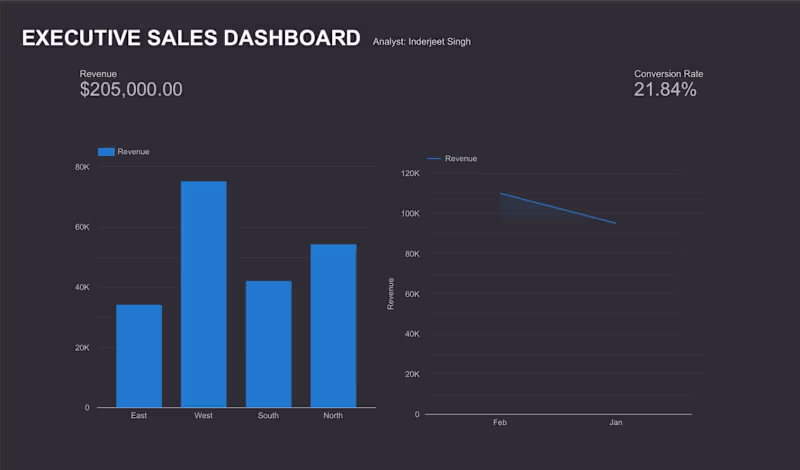
Inderjeet Singh
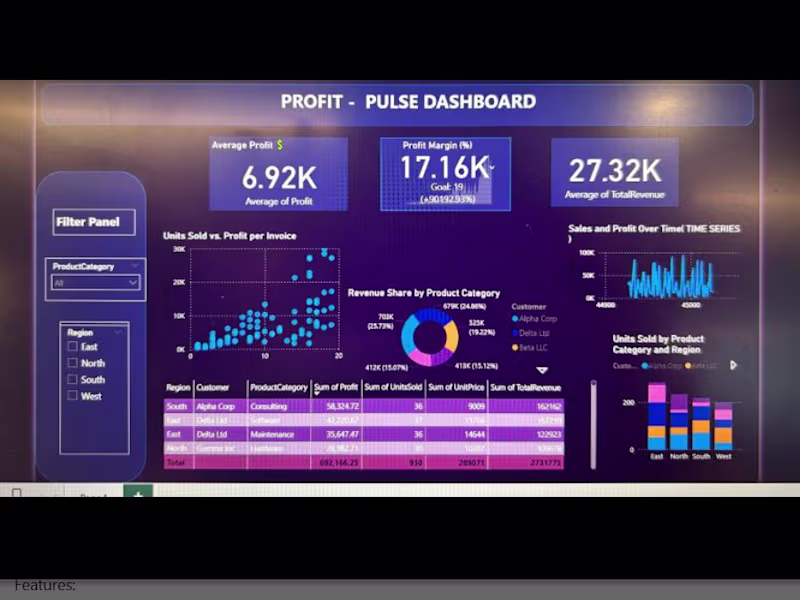
Built a live revenue dashboard showing Total Revenue, Conversion Rate, and Sales by Region — auto-updating from a Google Sheet. Eliminates manual reporting and gives leadership a single-screen view of business health in under 5 seconds.
0
32
Message
0
Mukesh Jaiswal
Mukesh Jaiswal on Instagram: ”#”
0
9
Explore projects