Freelancers using SQL in Nairobi CountyFreelancers using SQL in Nairobi County
Delivering Strategic Growth Through Data, Finance & Tech.
8
Followers
Delivering Strategic Growth Through Data, Finance & Tech.
Cover image for Alphabet Performance Analysis: What Business
Alphabet Performance Analysis: What Business Leaders Can Learn From One of the World’s Most Successful Companies Prepared by Intersect Analytics | Business Intelligence, Financial Analysis & Automation Prepared by Intersect Analytics At Intersect Analytics, we analyzed Alphabet Inc.’s financial and operational performance using Python for data extraction and transformation and Power BI for dashboard development to understand how business segments contribute to growth, profitability, and long-term performance. Key Findings Google Search Remains the Core Revenue Driver Google Search & Other continues contributing the largest share of Alphabet’s revenue, maintaining its leadership in digital advertising and search services. Google Cloud Continues Strong Growth Google Cloud remains one of Alphabet’s fastest-growing business segments, supported by increased enterprise demand, AI adoption, and cloud infrastructure expansion. YouTube Strengthens Revenue Performance YouTube continues generating strong advertising revenue, reinforcing Alphabet’s ability to monetize digital engagement at scale. Profitability Remains Strong Despite major investments in AI, cloud infrastructure, and innovation, Alphabet continues maintaining strong operational performance and financial resilience. Diversified Revenue Supports Stability Alphabet benefits from multiple business segments across Search, Cloud, YouTube, Devices, and Emerging Ventures, strengthening resilience and reducing dependency on a single revenue source. Recommendations ✔ Improve performance visibility through real-time dashboards and KPI tracking. ✔ Invest strategically in high-performing business segments. ✔ Use automation and analytics to improve reporting speed and decision-making. ✔ Strengthen operational monitoring to identify inefficiencies early. How Intersect Analytics Helps Businesses We help organizations transform manual reporting into intelligent business systems through: 📊 Power BI Dashboards & Business Intelligence 📈 Financial Analysis & Performance Reporting 🐍 Python Data Scraping & Automation ⚙️ Excel & Google Sheets Automation 🔄 Business Process Automation 📉 Data Analytics & Strategic Insights Why Choose Intersect Analytics ✅ Business-focused solutions ✅ Executive-quality dashboards ✅ Automation-driven reporting ✅ Scalable analytics systems Because growth is driven by better visibility, faster decisions, and intelligent execution. INTERSECT ANALYTICS Decisions Backed by Data. Growth Driven by Insight. 📞 +254 723 632 207
1
2
74
Cover image for Decoding Kenya’s Energy Future: Where
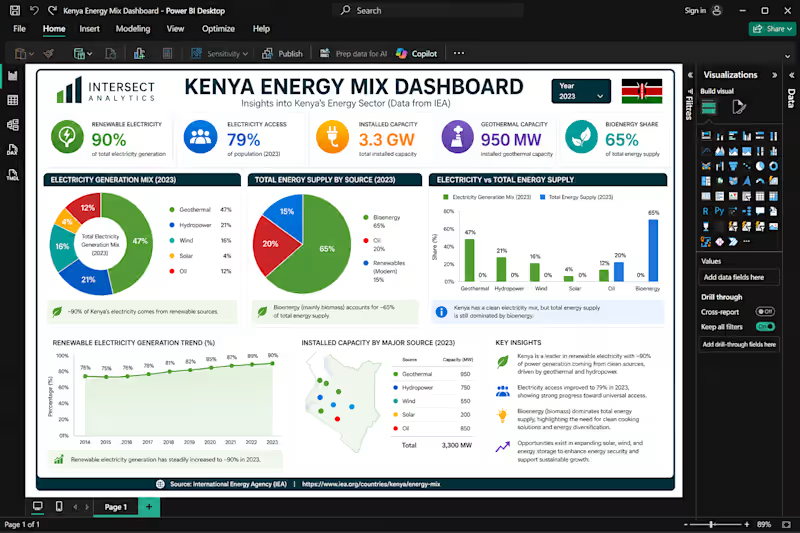
Decoding Kenya’s Energy Future: Where Data Meets Strategy Kenya has solidified its status as a global powerhouse in renewable energy, yet the raw figures only tell a fraction of the story. My recent comprehensive analysis of the national energy mix reveals a sophisticated narrative of leadership and untapped potential: ⚡ The Green Benchmark: Approximately 90% of Kenya’s electricity is generated from renewable sources, cementing our position as a global leader in geothermal and hydropower integration. 🌍 Closing the Access Gap: National electricity access has surged to approximately 79%, reflecting a resilient and rapidly expanding grid infrastructure. 🔥 The "Hidden" Transition: Despite a green grid, ~65% of total energy consumption remains tied to bioenergy. This highlights a critical gap—and a massive investment opportunity—within the clean cooking and industrial heat sectors. Our Core Competencies: Strategic Intelligence & Solution Architecture Visualizing trends is merely the baseline. At Intersect Analytics, we specialize in converting multi-layered datasets into executive-level intelligence. We empower organizations to transcend traditional "reporting" in favor of predictive, data-driven strategy. Our specialized services include: ✔ End-to-End Business Intelligence: Advanced dashboard development utilizing Power BI and Tableau. ✔ Financial & Market Modeling: Bespoke analytics for startups and established enterprises. ✔ Automated Reporting Systems: Eliminating operational bottlenecks through streamlined data pipelines. Why Partner with a Data Expert? Data is a liability if it cannot be interpreted. Partnering with a professional analyst ensures your information becomes a strategic asset: Objective Clarity: We remove the "noise" from your data, allowing you to identify the core drivers of your business growth without bias. Risk Mitigation: Professional modeling identifies outliers and potential failures before they impact your bottom line, moving your team from a reactive to a proactive stance. Operational Efficiency: By automating complex reporting tasks, we return valuable time to your leadership team, allowing them to focus on high-level execution rather than spreadsheet management. Scalability: We build data architectures that grow with you, ensuring your insights remain robust as your data volume increases. The Bottom Line: In a data-driven economy, clarity is your greatest competitive advantage. 🚀 Ready to uncover the narrative hidden within your data? Let’s connect and engineer the tools your business needs to scale. #DataAnalytics #EnergyTransition #Kenya #BusinessIntelligence #PowerBI #IntersectAnalytics #CleanEnergy
0
15
Cover image for This dashboard delivers a comprehensive
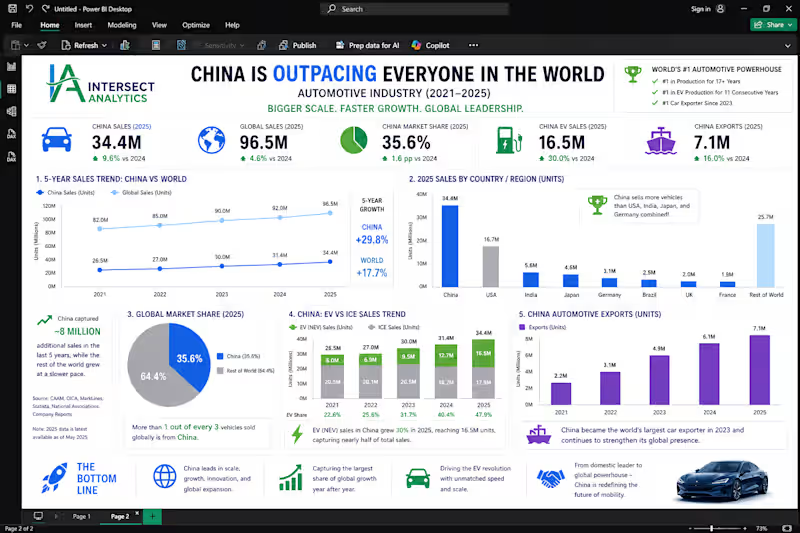
This dashboard delivers a comprehensive 5-year analysis (2021–2025) of the global automotive industry, clearly highlighting how China has emerged as the undisputed market leader. The data reveals that China is not only the largest automotive market globally, but also the fastest-growing, now accounting for over 35% of global vehicle sales. With strong growth in electric vehicles (EVs), exports, and total production, China is capturing the majority of global industry expansion while other major economies grow at a slower pace. Key insights from the dashboard include: China’s sales growth significantly outpaces global averages Rapid acceleration in EV adoption, nearing half of total sales Strong export growth positioning China as a global automotive powerhouse A widening gap between China and other major markets like the USA, Japan, and Germany 💼 About Our Services – Intersect Analytics At Intersect Analytics, we specialize in transforming complex data into clear, actionable insights that drive strategic decision-making. Our core services include: 📊 Interactive Dashboard Development (Power BI, Tableau) 📈 Data Analysis & Business Intelligence 🔍 Market Research & Industry Insights 🤖 Data Automation & Reporting Solutions 📉 Financial & Operational Analytics ⭐ Why Choose Intersect Analytics? Data-Driven Precision – We go beyond visuals to deliver insights that matter Business-Focused Approach – Every dashboard is tailored to support real decisions Advanced Technical Expertise – Skilled in Power BI, SQL, Python, and financial modeling Clean, Executive-Ready Designs – Dashboards that are both insightful and visually compelling Fast Turnaround, High Impact – We deliver quality solutions efficiently 🎯 The Bottom Line This dashboard is more than just a visual—it’s a strategic tool that clearly shows how global dynamics are shifting, with China leading the future of the automotive industry. 👉 With Intersect Analytics, you don’t just get data—you get clarity, direction, and a competitive edge.
1
3
77
Technical writer and developer advocate AI/ML
UX Specialist | Front-end Dev | Digital Marketer
Business Intelligence Analyst 🔢