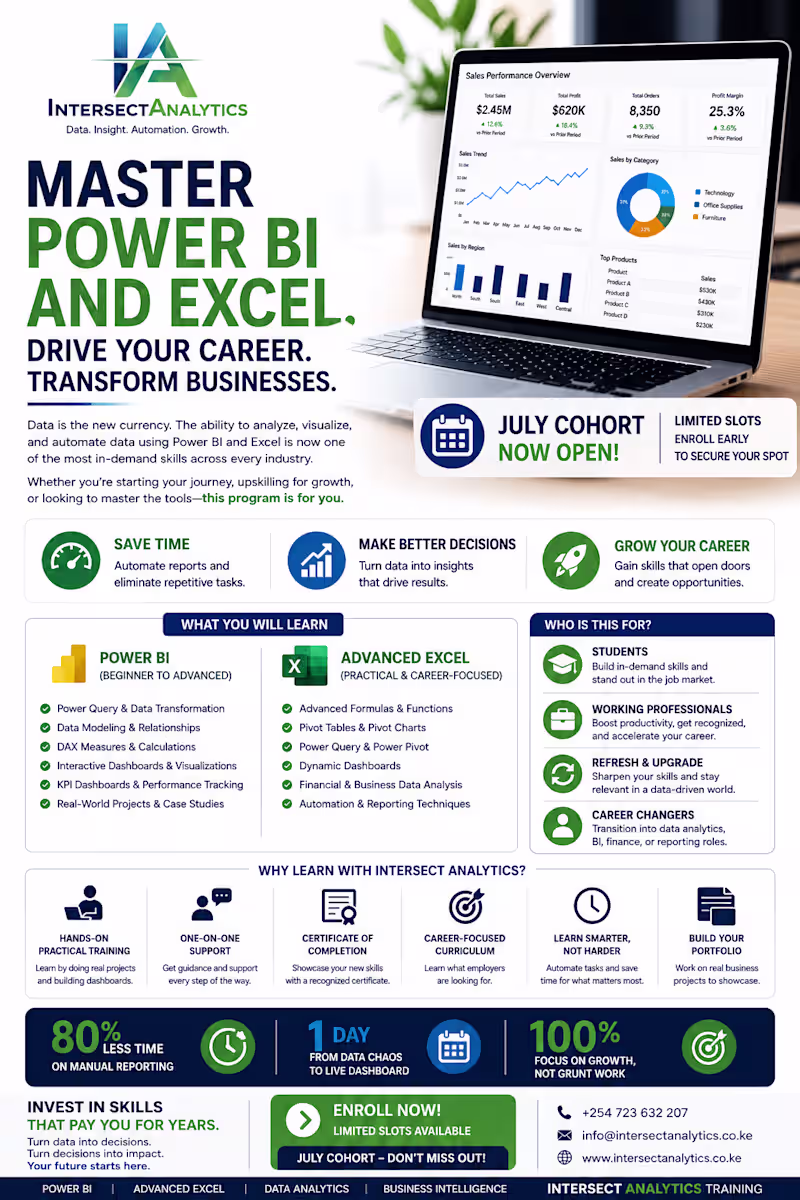
Delivering Strategic Growth Through Data, Finance & Tech.
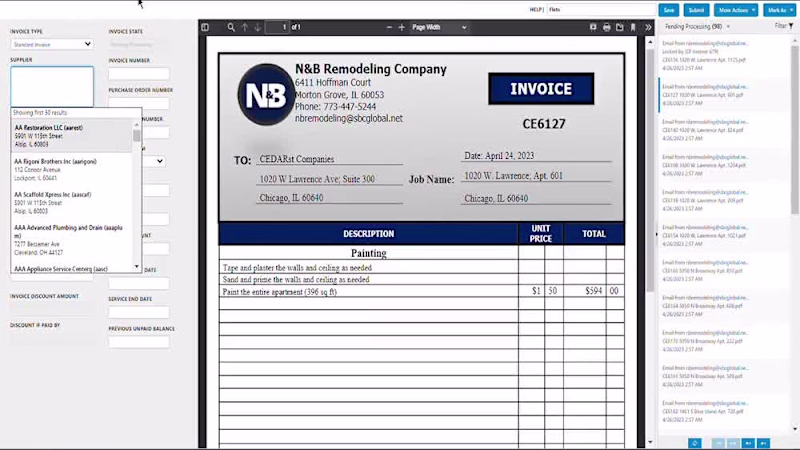
Data Analyst | Data Engineer
Data Analyst | Data Engineer

View more →
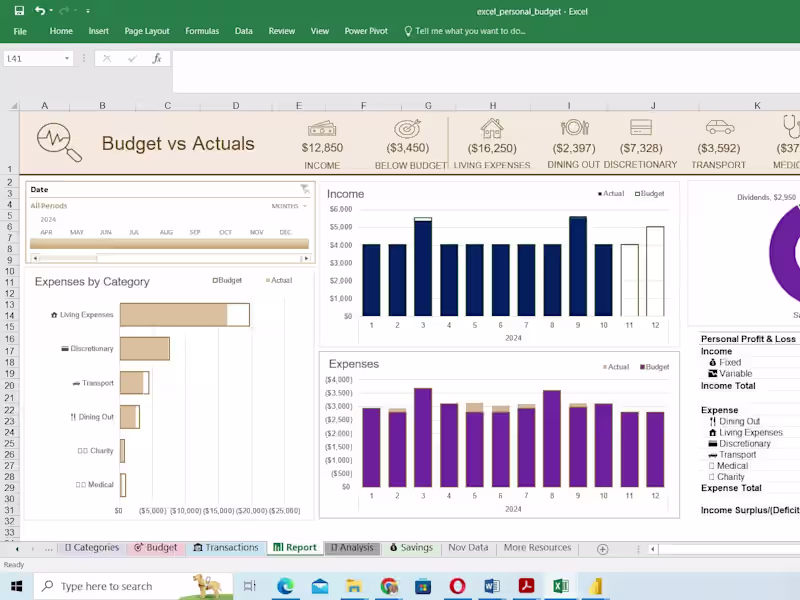
Expert Data Analyst: Transforming Data to Insight
Expert Data Analyst: Transforming Data to Insight

View more →
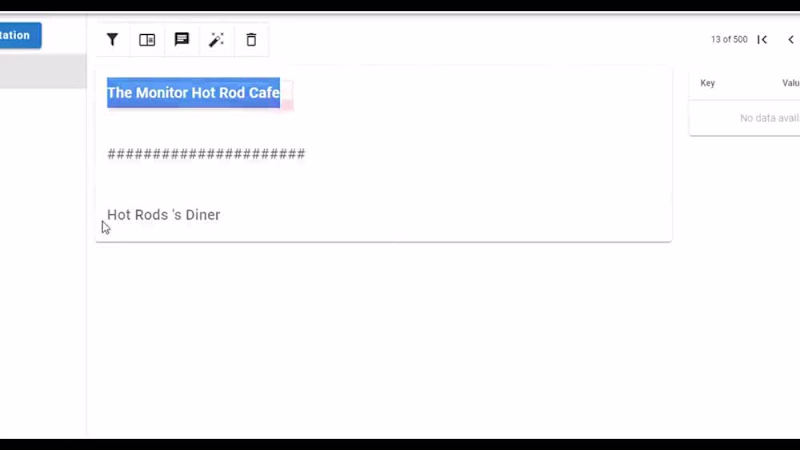
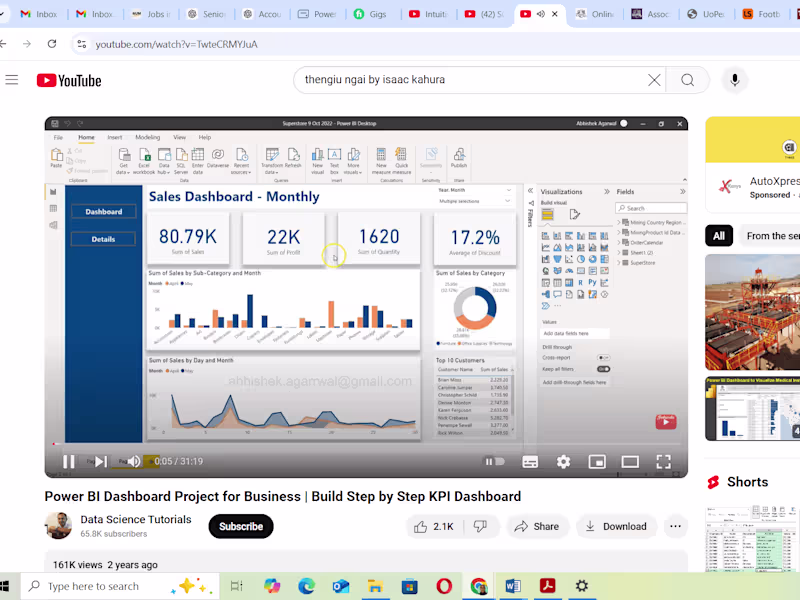
Passionate Technical Writer & Data Specialist
Passionate Technical Writer & Data Specialist

View more →
Custom IT & Design Solutions for Your Business 🚀
Custom IT & Design Solutions for Your Business 🚀


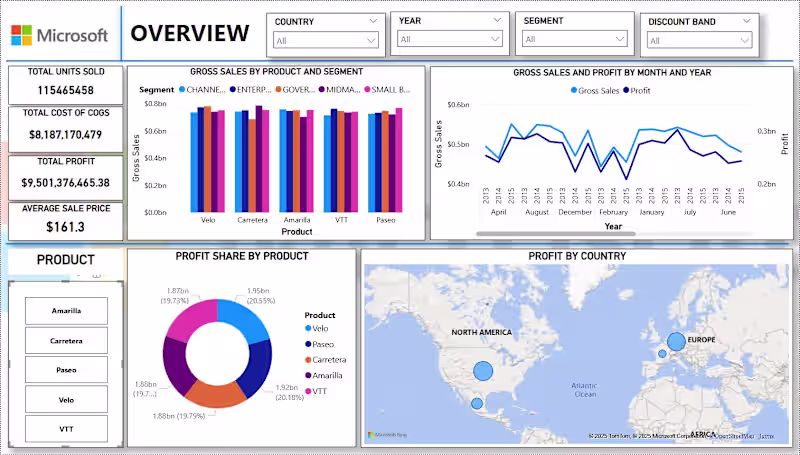
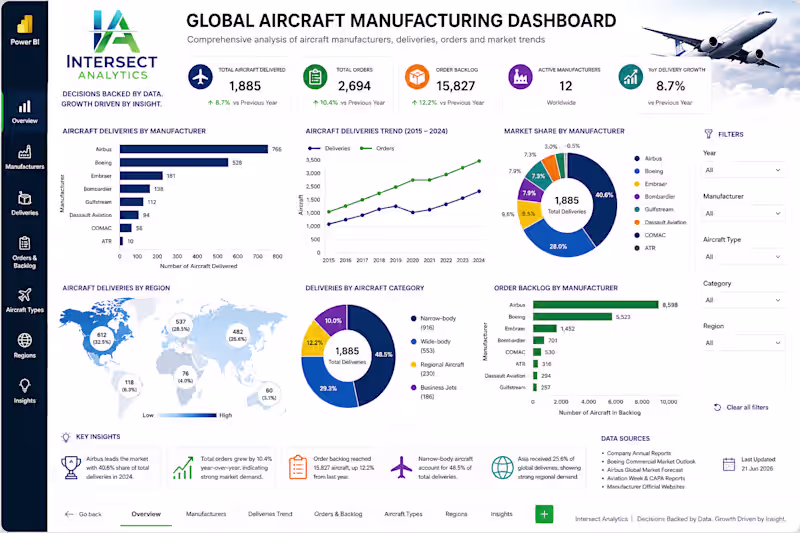
Certified Data Analyst & Visualizer 📊
Certified Data Analyst & Visualizer 📊


View more →
Empowering Businesses with Data Visuals
Empowering Businesses with Data Visuals
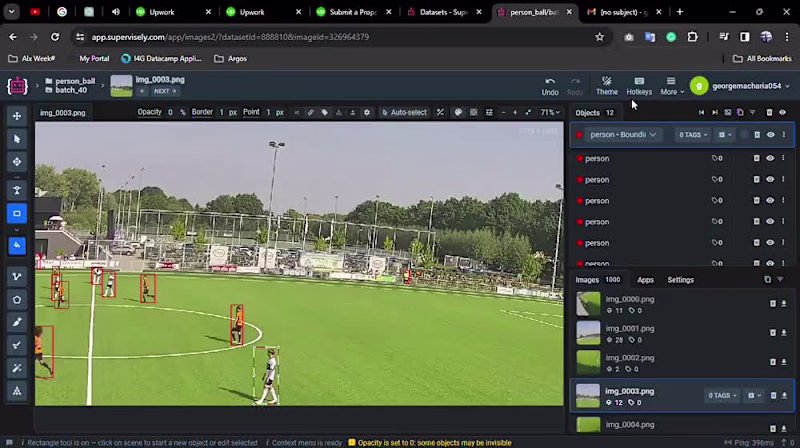
Data Annotator/Labeler for ML & AI