Data Analysis Projects in MumbaiData Analysis Projects in MumbaiEnd-to-End Procurement & Strategic Sourcing
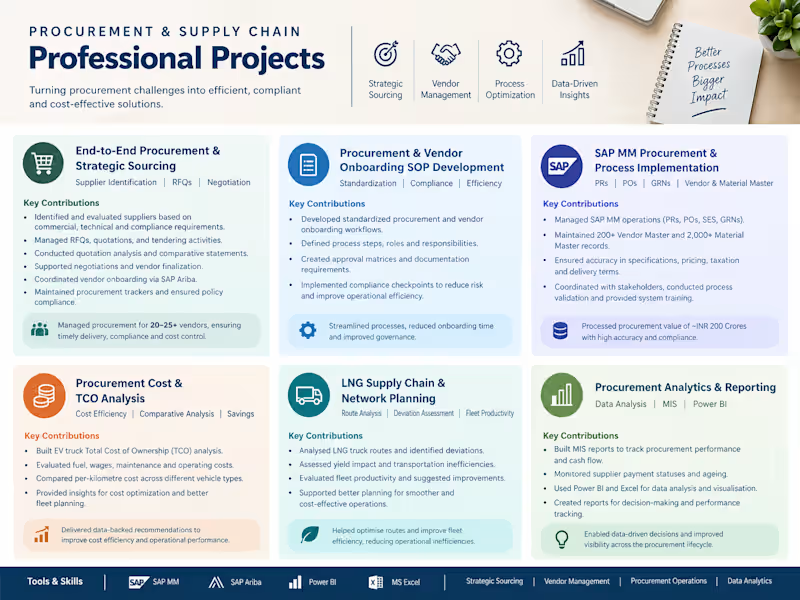
I managed end-to-end procurement activities across data centre and LNG operations, supporting supplier identification, RFQs, quotation analysis, negotiations, vendor selection, order processing, expediting, and payment coordination.
What I Delivered:
1. Identified and evaluated suppliers based on commercial, technical, and compliance requirements.
2. Prepared and managed RFQs and tendering activities.
3. Analyzed vendor quotations and prepared comparative statements.
4. Supported supplier negotiations and vendor finalization.
5. Coordinated vendor onboarding and compliance documentation through SAP Ariba.
6. Managed procurement trackers and maintained accurate procurement records.
7. Coordinated with Operations, Finance, Legal, Compliance, and external stakeholders.
8. Ensured procurement activities followed internal policies and governance requirements.
Tools & Skills
Strategic Sourcing · RFQ Management · Vendor Management · Negotiation · Tendering · Quotation Analysis · SAP Ariba · SAP MM · Procurement Operations · Cost Control 📊 Sales Tracking Dashboard | Excel + Power BI Project
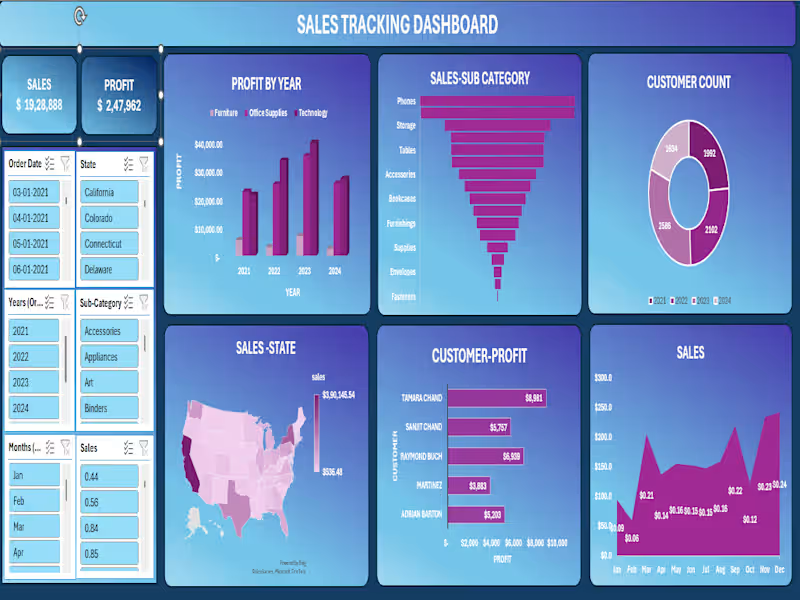
Built an end-to-end interactive Sales Tracking Dashboard covering 2021–2024 across the entire US market.
Top-Line Numbers:
💰 Total Sales: $19,28,888
📈 Total Profit: $2,47,962
👥 Total Customers: 8,314 across all years
What the dashboard reveals:
🏆 Best-selling sub-categories: Phones ($2,79,464) and Chairs ($2,77,058) lead the pack — together accounting for nearly 29% of all sales
📅 Profit growth year-on-year:
→ 2021: $49,556 → 2022: $61,618 → 2023: $81,786 — consistent upward trajectory across Furniture, Office Supplies & Technology
🗺️ Geographic concentration: California dominates at $3,90,145 in sales. New York ($2,46,517) and Texas ($1,51,436) follow. West Virginia sits at the bottom with just $536 — a clear signal for regional strategy review.
📦 Technology drives profit — highest-margin category across all 4 years, despite Furniture holding significant volume
🧾 Seasonal trends: Q4 is king — November ($2,34,013) and December ($2,41,464) are the strongest months. February dips to just $59,640 — opportunity for targeted campaigns.
👤 Top customer by profit: Tamara Chand at $8,981, followed by Raymond Buch ($6,939) and Sanjit Chand ($5,757)
Tools used: Microsoft Excel · Pivot Tables · Power Query · Charts & Slicers · Dashboard Design
This project sharpened my ability to turn raw transactional data into a clean, decision-ready visual — with filters for state, date, year, sub-category, and month.
Open to feedback! 👇
#Excel #DataAnalytics #SalesDashboard #DataVisualization #BusinessIntelligence #MicrosoftExcel #DashboardDesign