:::Operations Dashboard Sample
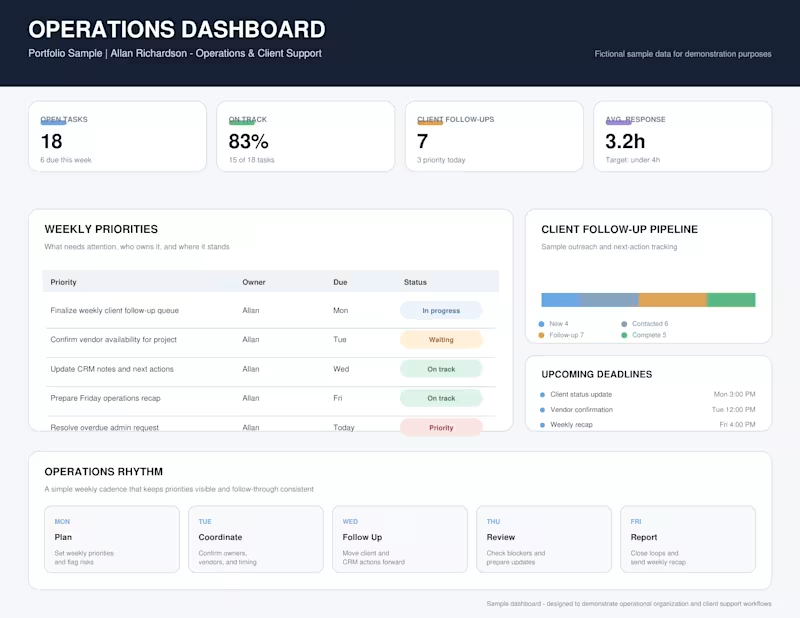
A sample operations dashboard designed to show how I organize priorities, deadlines, client follow-ups, task ownership, and weekly workflows in one place. This mockup demonstrates how I structure operational information so teams can quickly see what needs attention, what is on track, and what needs follow-up.
The dashboard includes weekly priorities, client pipeline tracking, deadlines, response-time metrics, and a simple operating rhythm. All data shown is fictional and used for demonstration purposes only.
2
101


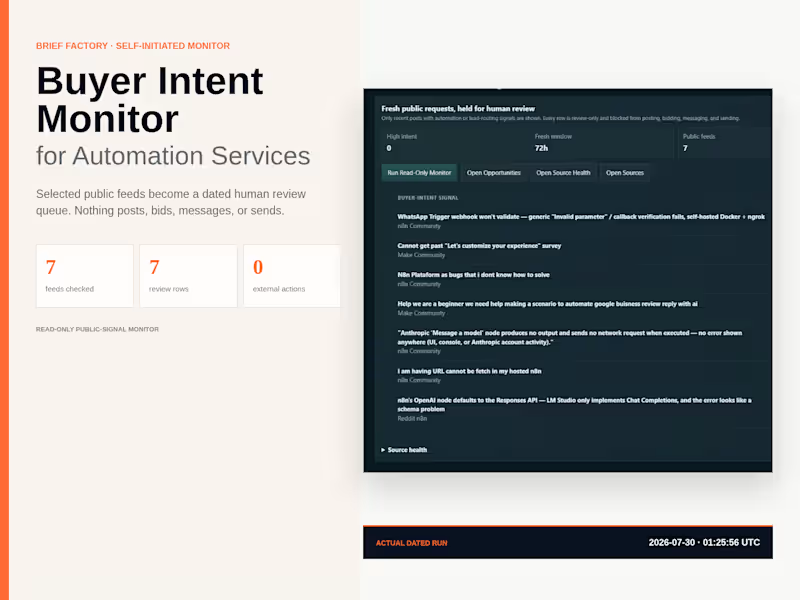
A self-initiated Brief Factory internal system. The gallery shows public post titles only. No names, handles, contact details, or private messages are shown.
I built this to make public automation research more consistent. Instead of manually checking communities for scattered requests, the monitor reads selected RSS and Atom feeds, normalizes source URLs, rejects stale or generic items, scores observable workflow pain, deduplicates accepted rows, and records source health.
The output is a structured review queue, not permission to contact anyone. The system does not post, bid, message, or send.
The gallery shows a dated run from July 30, 2026: seven configured feeds, seven review rows, two HTTP 429 rate limits, zero high-intent rows, and zero external actions authorized.
Best fit: public-source monitoring, qualification queues, source-health reporting, research triage, and review-first opportunity workflows.
0
91