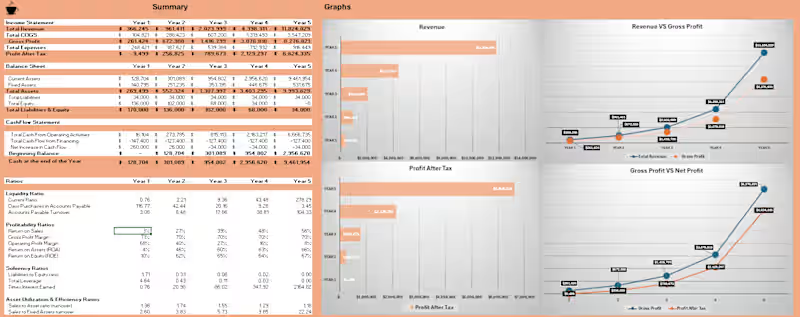
Turning Process Data into Visual Insight😯🤯
Process data alone doesn’t create insight.
Visual structure does.
By combining:
• chemical engineering logic
• clean graphic layouts
• clear charts and flow visuals
Raw data becomes decision-ready information.
Engineering tells you what’s happening.
Design shows you why it matters.🤠
2
7
356

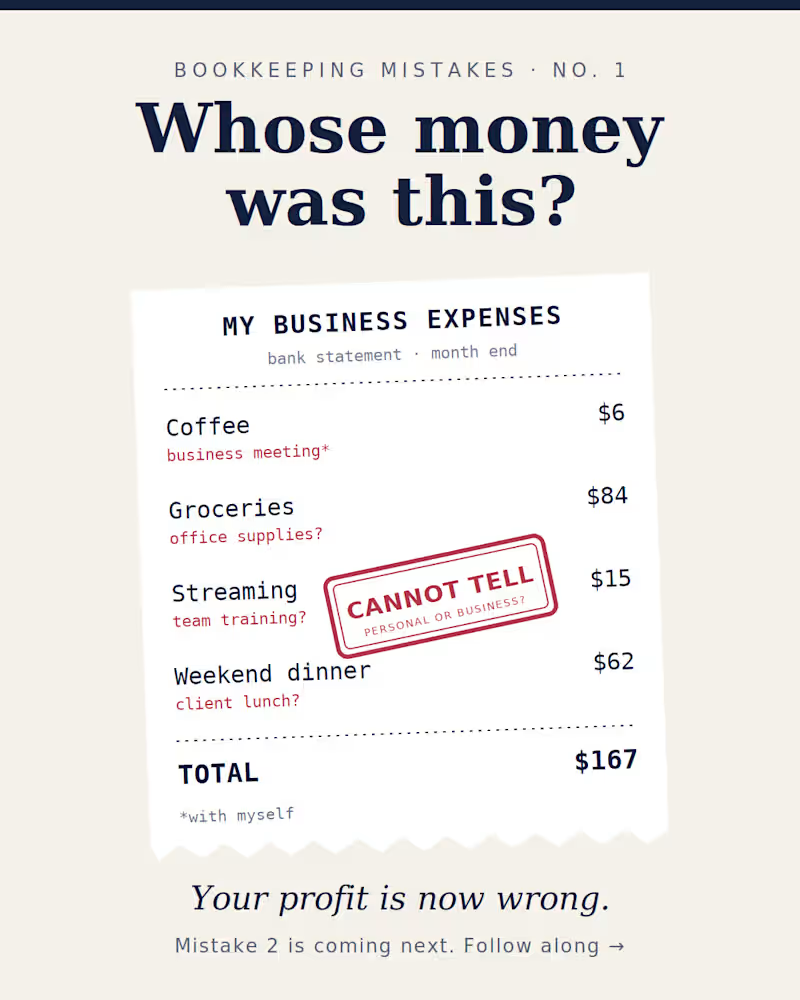
I am calling this the "Mistake post".
Wait. Did I post this by mistake?....
No, I promise. This is a bookkeeping post about the mistakes that quietly cost business owners money. There are many, so I will take one mistake at a time. This post is only about Mistake 1.
Mistake 1: Mixing personal and business spending One coffee here, one grocery bill there, and by the end of the month nobody knows whose money was spent. Yes, that coffee was a "business meeting". With yourself.
It looks small. It is not. Here is what it quietly does to your business:
Your profit becomes wrong. Personal costs sit inside business expenses, so the numbers do not show how the business is really performing.
Your bank reconciliation becomes slow. Every personal payment needs an explanation before your books can match the bank statement.
Your tax work becomes harder. When costs are mixed, it is difficult to prove which expenses truly belong to the business.
You lose clarity. You cannot tell how much the business earned and how much you took out for yourself.
Check your statement once a week. Small habit. Clean books. Much less stress at year end.
Mistake 2 is coming in the next post, so follow along so you do not miss it.
1
3
356
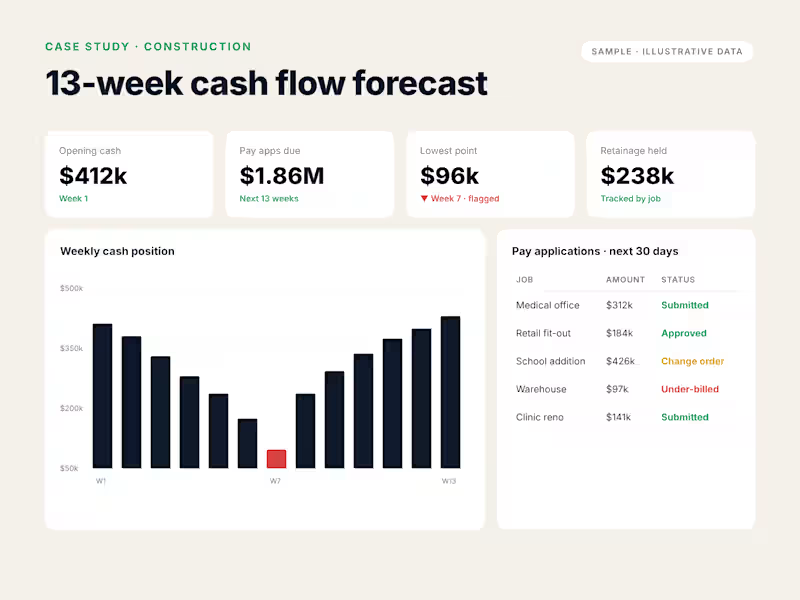
13-week cash flow forecast for a commercial contractor running five active jobs: opening cash, scheduled pay applications, payroll, subcontractor and supplier payments, and retainage tracked by job. The forecast flagged a week-7 low point early, so under-billed work and a pending change order were pushed through before the gap hit. (Sample with illustrative data.)
0
61

🏗️ Tracks Announced: RC-FBSIC 2027
We are pleased to announce the 7 tracks of the 2nd International
Conference on Future Building & Sustainability (RC-FBSIC 2027), 28–29
January 2027 (Online), organized by Research Corridor Inc. (Canada) with
reCore.
1️⃣ AI for the Built Environment & Infrastructure
2️⃣ Smart Cities, IoT & Urban Digital Systems
3️⃣ Sustainable Engineering & Green Construction
4️⃣ Peace & Conflict Resolution
5️⃣ Education Technology & Intelligent Learning Systems
6️⃣ Social Sciences, Human Behavior & Sustainable Development
7️⃣ Technology Policy, Governance & Legal Frameworks
📅 Abstract deadline: 4 December 2026
(36 days to go)
✅ No fee for abstract submission
✅ $45 covers paper presentation, book chapter publication (with ISBN &
DOI) and certificates from a multinational academic platform
✅ Free publication in Research Corridor open access, peer-reviewed
journals
Submit your abstract: https://rcfbsic.ca/
(https://rcfbsic.ca/)Contact: contact@researchcorridor.ca
(mailto:contact@researchcorridor.ca)| +1 (416) 818-4435 | =923218884362
#RCFBSIC2027 #ResearchCorridor #Sustainability #FutureBuilding
#CallForPapers #AcademicConference #SmartCities #AIinConstruction
0
61


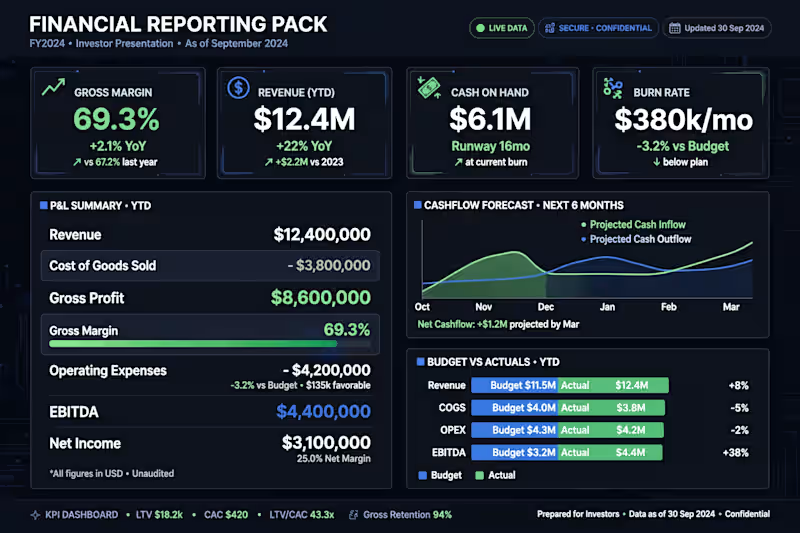
FinOps automation across seven environments
Automated scheduling and rightsizing that took roughly $280k a year out of the cloud bill.
Who it was for: A large regional bank running seven cloud environments.
The problem. Seven environments, most of them idle outside working hours, and no visibility into which team was spending what. Cost conversations were happening after the invoice rather than before.
What I did. Established a cost baseline per environment, then automated resource scheduling so non-production stopped paying for nights and weekends. Rightsized the workloads that were provisioned for peaks that never came. Built daily and weekly cost reporting so stakeholders could see the trend without asking for it.
The result. Around $280k of annual run-rate removed, with ongoing reporting that keeps the saving from creeping back.
0
66



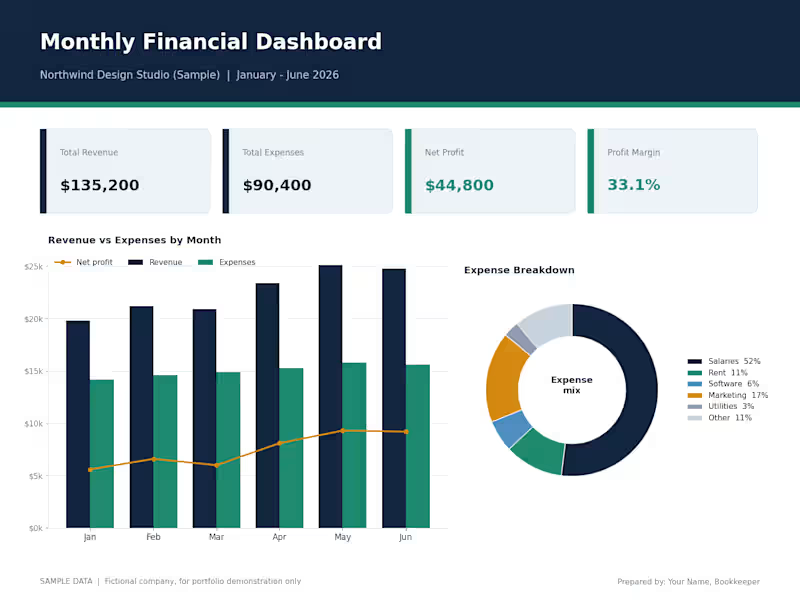
Monthly Financial Dashboard: Revenue, Expenses & Profit A visual summary of your finances: total revenue, expenses, net profit and profit margin, plus a monthly trend chart and an expense breakdown. I turn bookkeeping records into simple dashboards so you can see where your money comes from and where it goes.
2
2
218