Data Analysis Projects in Lagos
Data Analysis Projects in Lagos
Sign Up
Post a job
Sign Up
Log In
Filters
2
Projects
People
Message
4
Atanranshe Oluwabusola
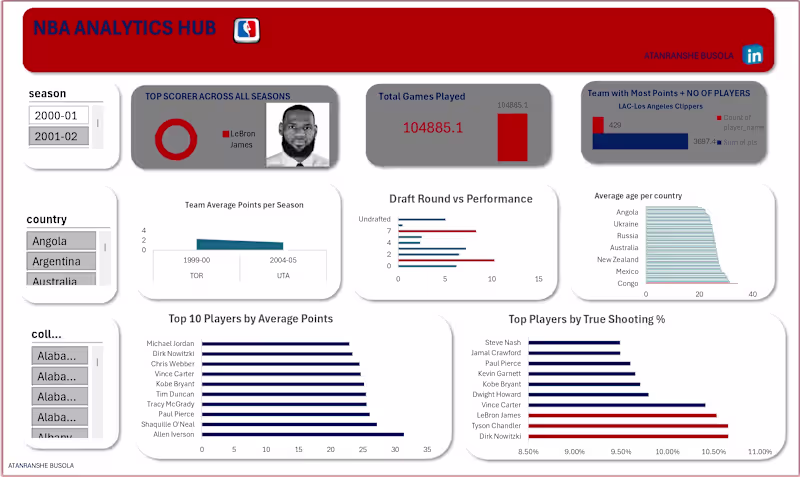
NBA ANALYTICS HUB
4
65
Message
3
Victor Ogunyemi
Picashot
3
4
Message
1
Yusuf Adetona
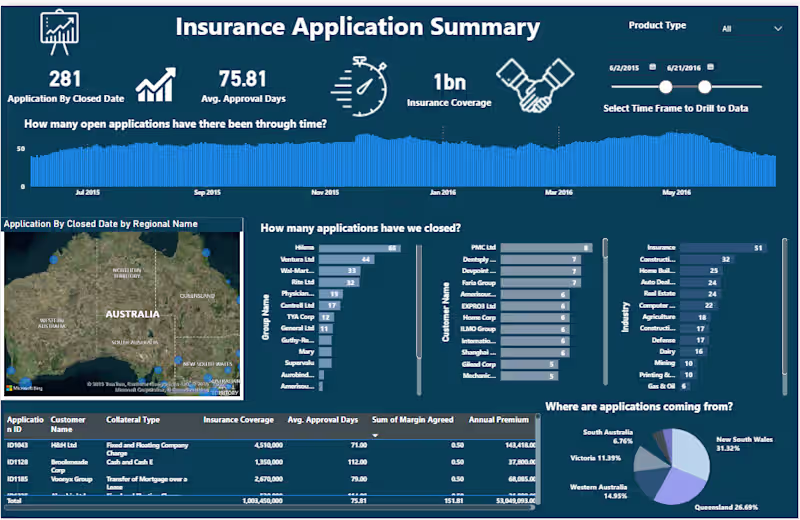
My latest build turns that chaos into a sleek, interactive Insurance Application Summary Dashboard built for speed, insight, and control. Traditional reports hide insights behind endless spreadsheets. This dashboard flips the script, it reveals the story instantly: Clarity isn’t cosmetic, it’s profit. Good reporting tells what happened. Creative reporting shows where to act next. By blending storytelling, interactivity, and business logic, this becomes a true decision engine for underwriting teams. If approvals still take 75 days, your reporting is the bottleneck. I build data products that turn chaos into profit-driving clarity. Now open to projects merging data strategy + design + visualization for faster, smarter decisions. 📊 Explore the vision. 💬 DM to discuss your toughest data challenge.
1
84
Message
2
Oluwatosin Lawal
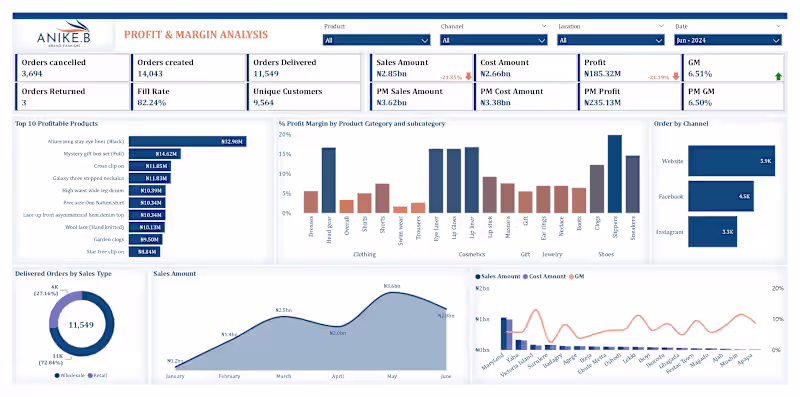
Anike Bridge Profit Analysis
2
168
Message
0
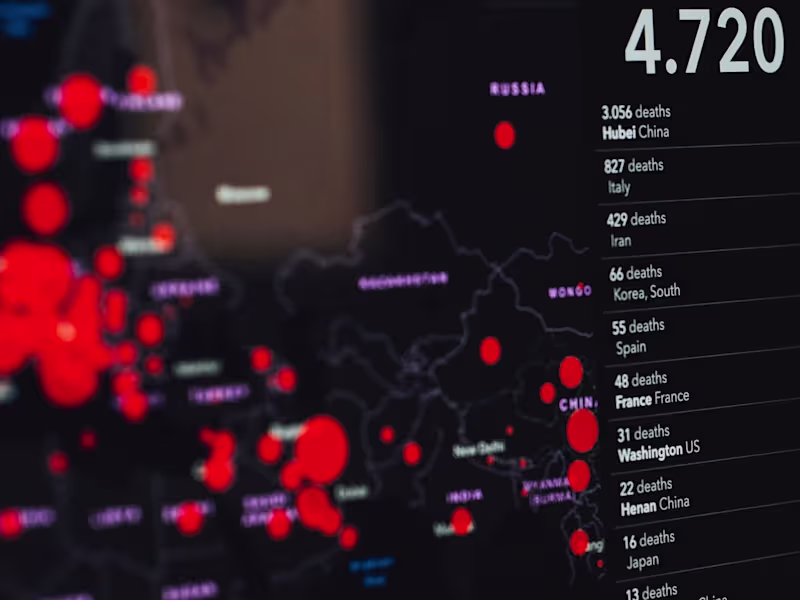
Victory Nnaji
COVID-19 Dashboard for Berlin City
0
16
Message
1
Damilola Akinrinmade
This project takes a fraud-detection model built in a notebook and turns it into a small, runnable system you can demo and deploy locally. In my workflow, I start with the notebook, save a single artifact, then wrap it with an API, a UI, and basic monitoring. 1 (https://1). Train and evaluate a model on creditcard.csv 2. Save a deployable artifact (.pkl) 3. Serve predictions through a FastAPI backend 4. Provide a Streamlit UI for manual testing and batch scoring 5. Log predictions and feedback labels for monitoring 6. Run basic drift checks and export feature importance for sanity checks What Problem This Solves Fraud detection is a highly imbalanced classification problem, so "accuracy" is usually misleading. What you typically want is: 1 (https://1). a risk score (fraud probability) per transaction 2. a decision policy (threshold) you can tune to match operational goals (precision/recall tradeoff) 3. serving layer so the model works outside Jupyter 4. a monitoring loop so you can detect drift and decide when to retrain
1
66
Message
0
Kelechukwu Igu
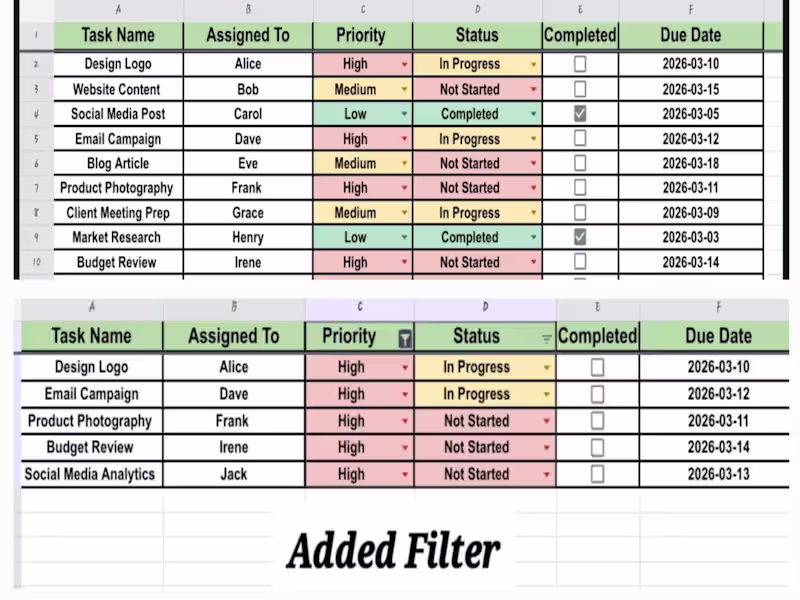
Created an interactive task tracking spreadsheet in Google Sheets to demonstrate practical spreadsheet management and data organization skills. The sheet includes dropdown menus for priority and task status, checkboxes to track completion, and color-coded conditional formatting to visually highlight task urgency and progress. Filters were added to allow quick sorting and viewing of tasks by priority, status, or completion state. This demo showcases the ability to build organized, user-friendly spreadsheets that improve workflow tracking and data visibility.
0
25
Message
1
Dayo Olalere - Simply Laurels
Business Growth Analysis
1
7
Message
0
Edward Eniang
Data Nerd
0
9
Message
0
James Odukoya
COVID-19 Global Data Analysis
0
12
Message
1
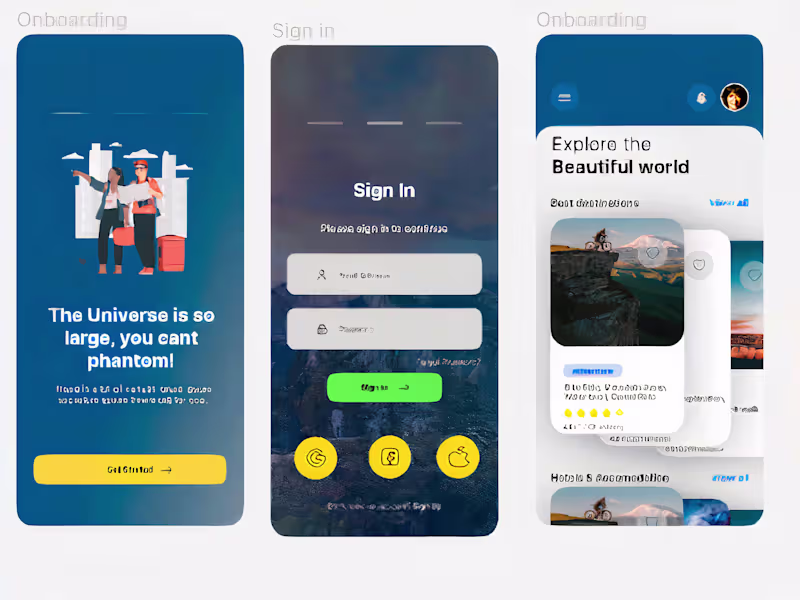
Tobi Caleb
UX Design for a travel app
1
17
Message
1
Oluwaseyi Oshin
Google Analytics 4 & Google Tag Manager
1
4
Message
1
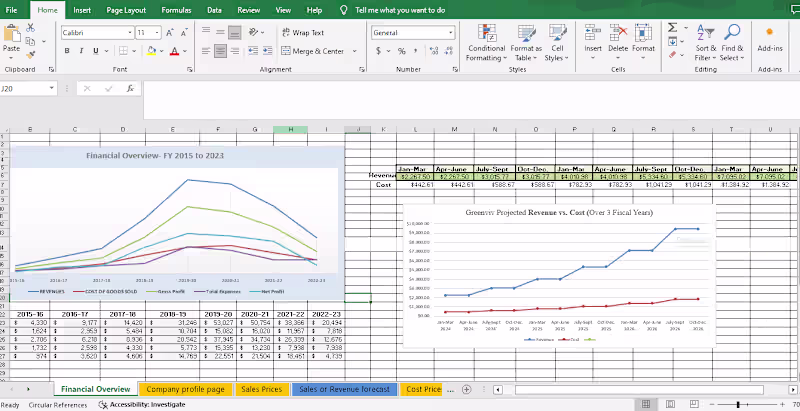
Habeeb Abdulrasaq
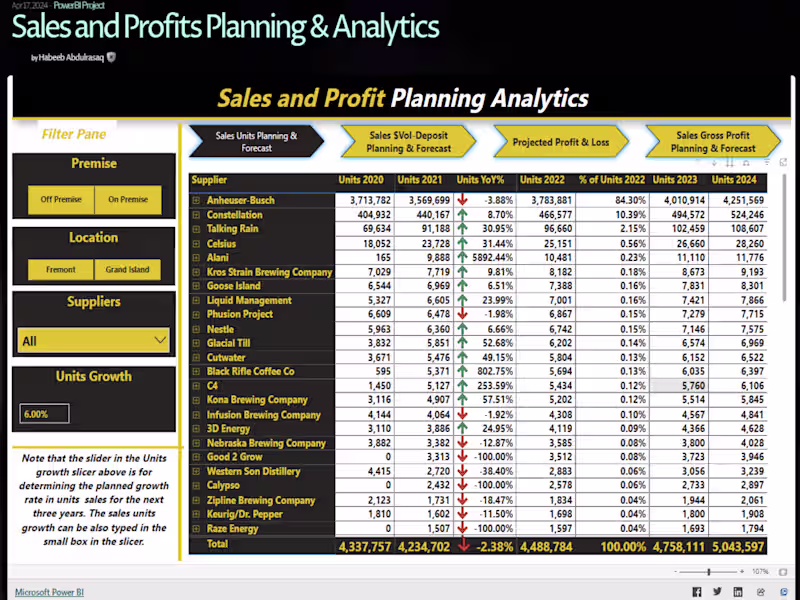
Sales and Profit Planning Analytics
1
10
Message
2
Felix Okechukwu
Data Cleanup and Analytics with PowerBI & SQL
2
33
Message
0
Cecilia Ojile
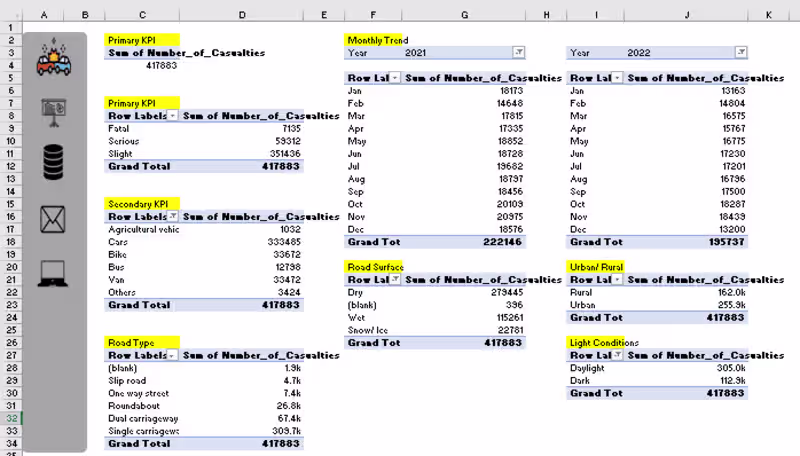
Road Accident Report
0
2
Message
0
Omolara Kasali
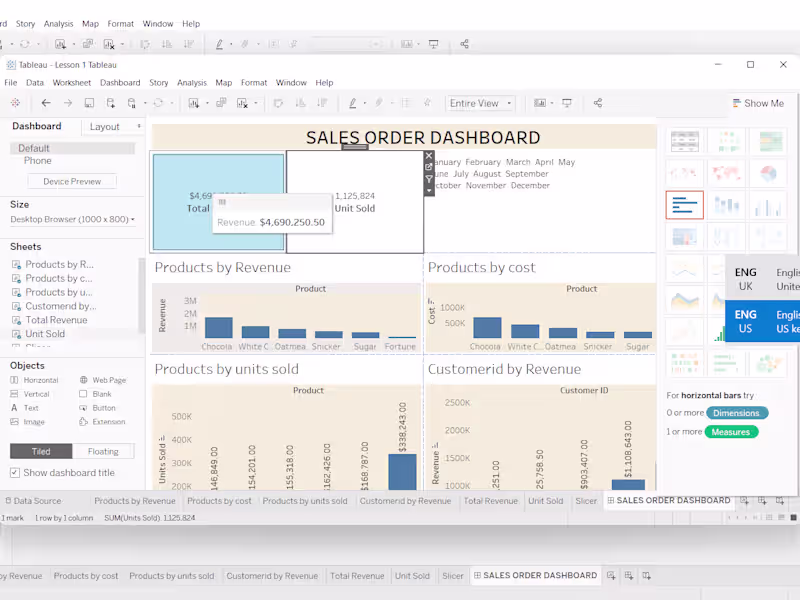
Sales Order Dashboard
0
3
Explore projects