Projects using Microsoft Power BI in KagalProjects using Microsoft Power BI in KagalI’m a Data Analyst specializing in cleaning, structuring, and analyzing marketing and sales data using Python, Excel, SQL, and Power BI.
I help businesses fix broken data pipelines, resolve formatting issues, and turn raw data into accurate dashboards that support decision-making.
My work focuses on clarity, reliability, and scalability—ensuring reports remain consistent as data grows.
If you’re struggling with inconsistent data or dashboards that don’t reflect reality, I can help streamline the process end-to-end. 🚀 SQL & Tableau Project | Sales Analytics Dashboard
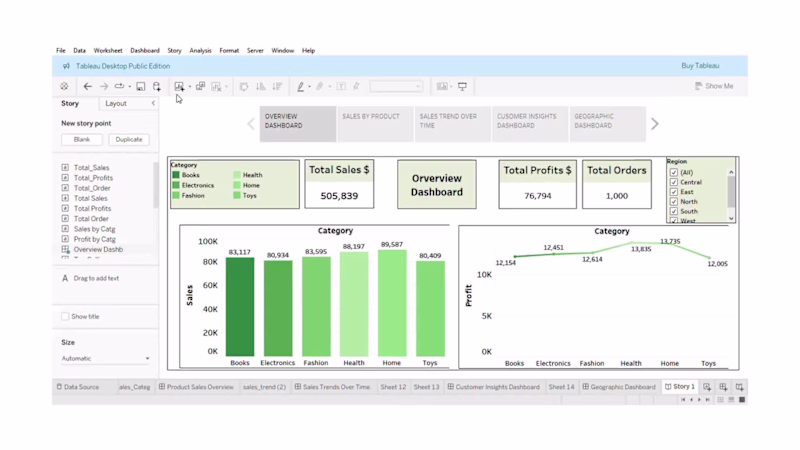
To practice real-world analytics, I built an interactive Sales Analytics Dashboard using SQL & Tableau to analyze sales performance and customer behavior.
🔹 Dataset Highlights
OrderID, CustomerID, Product, Category, Sales, Quantity, Discount, Profit, Region, OrderDate
🔹 Dashboard Coverage
• Sales overview: Total Sales, Profit & Orders
• Product performance: Top-selling products & category insights
• Monthly sales trends
🔹 Tools Used
• SQL
• Tableau
🔹 Key Insights
• A small customer segment drives most revenue
• Certain product categories consistently outperform others
• Clear seasonal sales patterns
🔹 What I Learned
• Writing efficient SQL queries for analysis
• Translating numbers into business-friendly visuals
• Designing dashboards that support data-driven decisions Sales, Customer & Marketing Analytics in Power BI
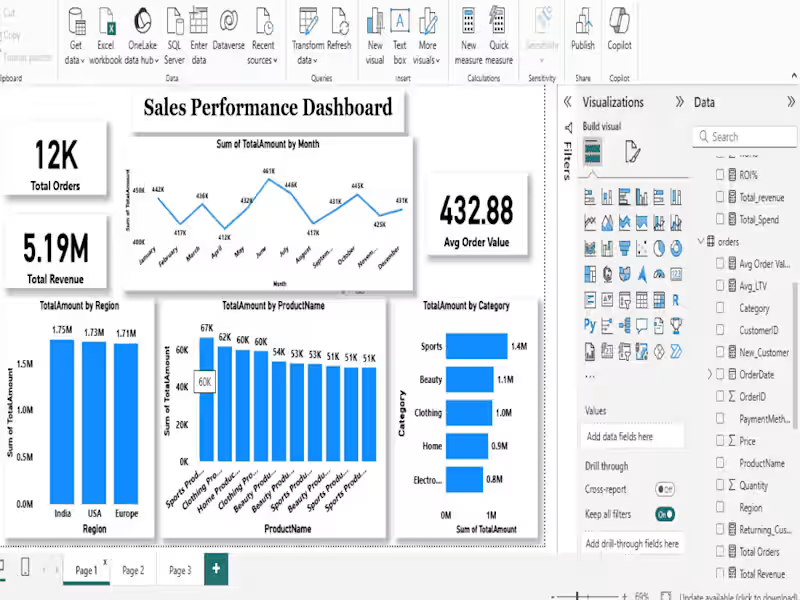
I built a complete 3-page Power BI dashboard to analyze Sales performance, Customer behavior, and Marketing ROI—all in one place.
🔍 Sales Overview
Revenue trends & top product categories
Total Sales, Orders & Average Order Value
Region-wise and payment method analysis
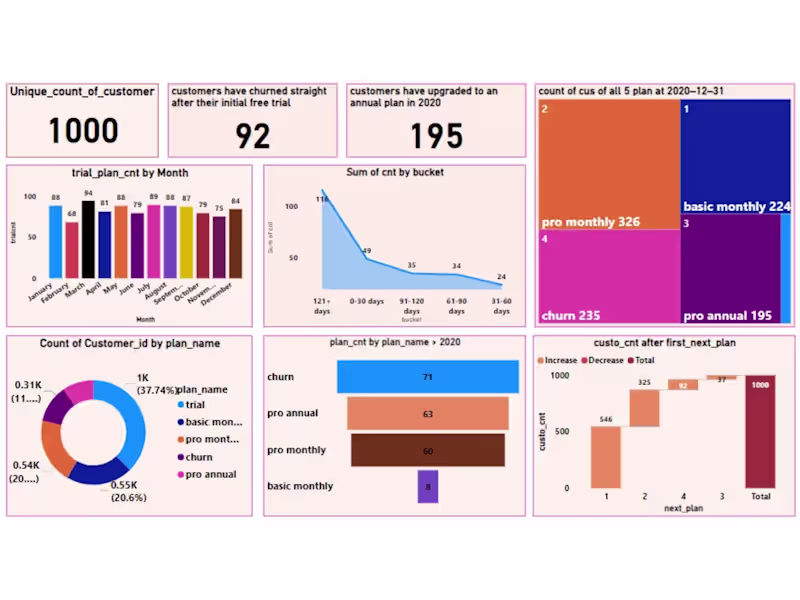
👥 Customer Insights
New vs Returning customers
Customer Lifetime Value (LTV) by region
Purchase frequency & repeat behavior using DAX
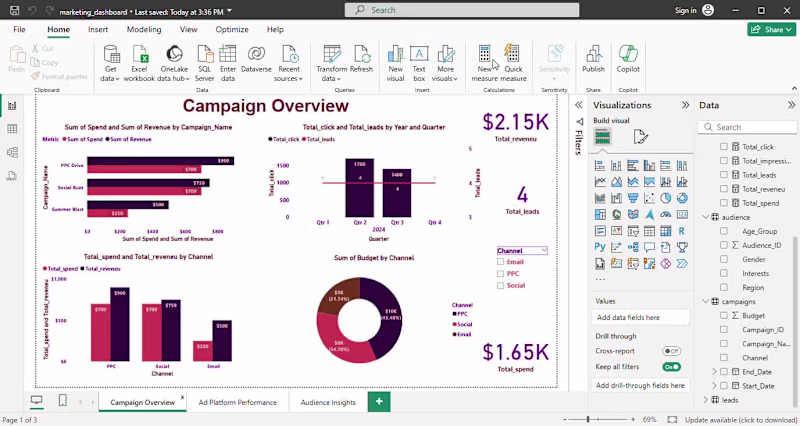
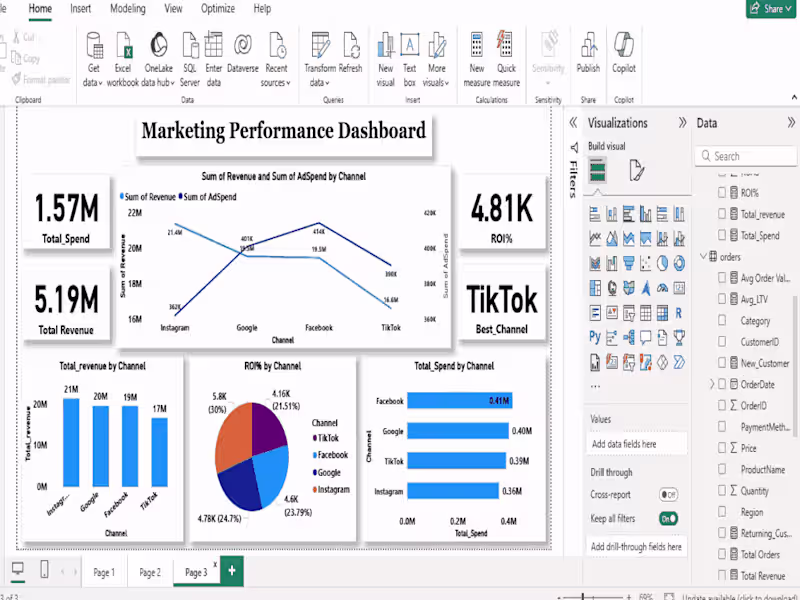
📈 Marketing Performance
Spend vs Revenue across Paid Ads, Social, Referral, Influencer/UGC, Email & Offline
Clear ROI comparison to identify winning and underperforming channels
🛠 Tools Used: Power BI, SQL, DAX, CSV
💡 Outcome:
This project shows how combining Sales, Customer, and Marketing data helps businesses make faster, smarter decisions.