Data Visualization Projects in India
Data Visualization Projects in India
Sign Up
Post a job
Sign Up
Log In
Filters
2
Projects
People
Message
0
Denish Kukadiya
pro
Looker Studio Dashboard for your Business and Marketing Team
0
77
Message
0
Shriya Gupta
pro
Introducing a Game Changing User Dashboard
0
4
Message
0
Sparsh Gupta
pro
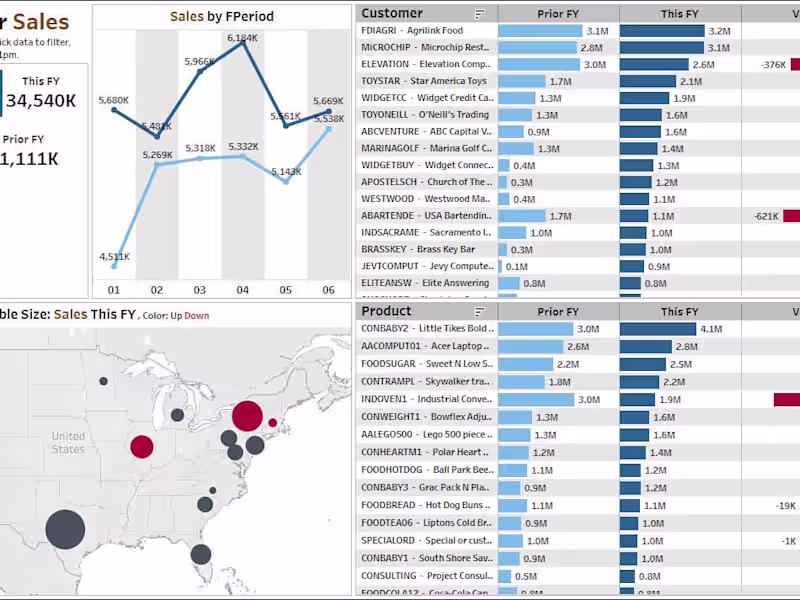
Tableau Pricing Tool for Sales Team
0
18
Message
11
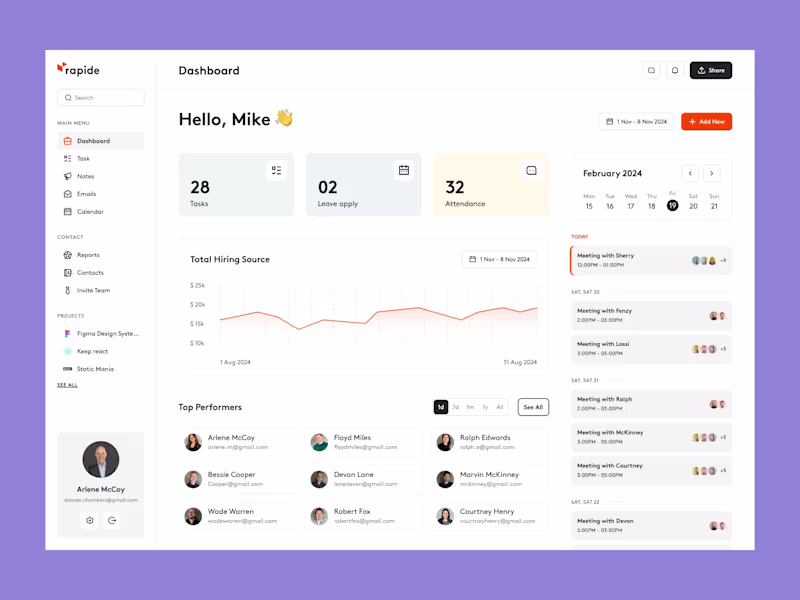
Abhiram Tinguria
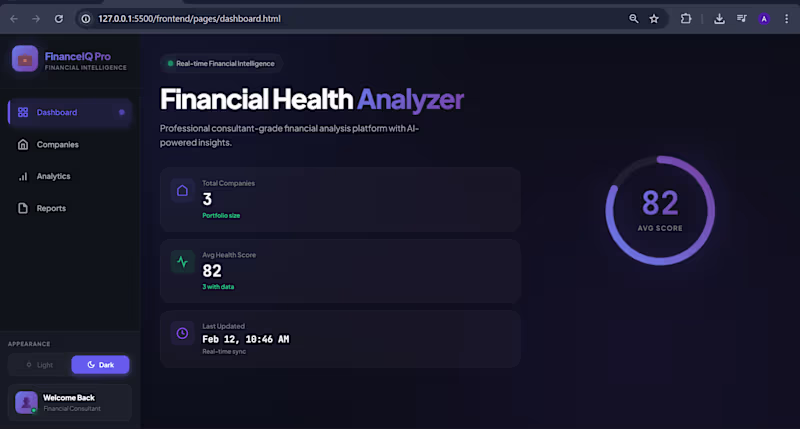
Financial Health Dashboard for Business Decisions
11
24
Message
0
Enertia CGI works
pro
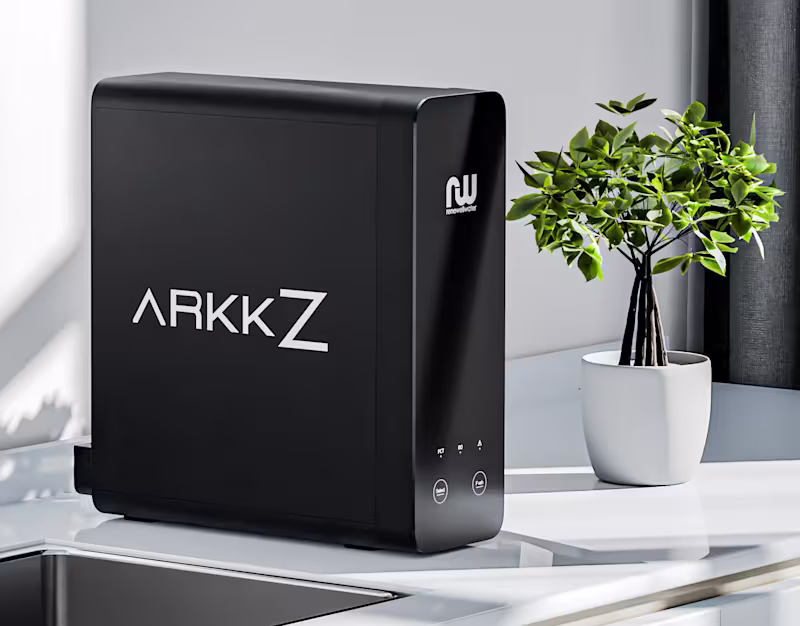
ARKKZ ION III Water Filteration System
0
1
Message
2
Geethasree Naguboina
pro
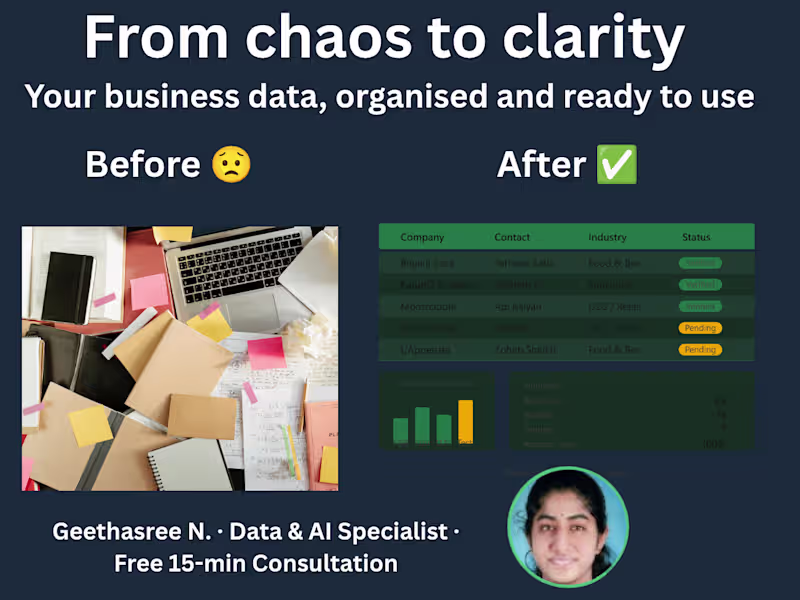
Most small business owners I talk to have the same problem — their data is scattered across WhatsApp messages, paper notes, and half-filled Excel sheets. They know something is wrong. They just don't know where to start. Here's what I do in the first 30 minutes of any project: ✅ Understand what data you have and where it lives ✅ Identify what's missing, duplicate, or inconsistent ✅ Suggest the simplest structure that works for your business No complicated tools. No jargon. Just clean, organised data you can actually use. If your business data feels messy and overwhelming — let's fix that together. Message me and we'll start with a free 15-minute consultation. 📊
2
34
Message
1
Ravi chandu Edru
pro
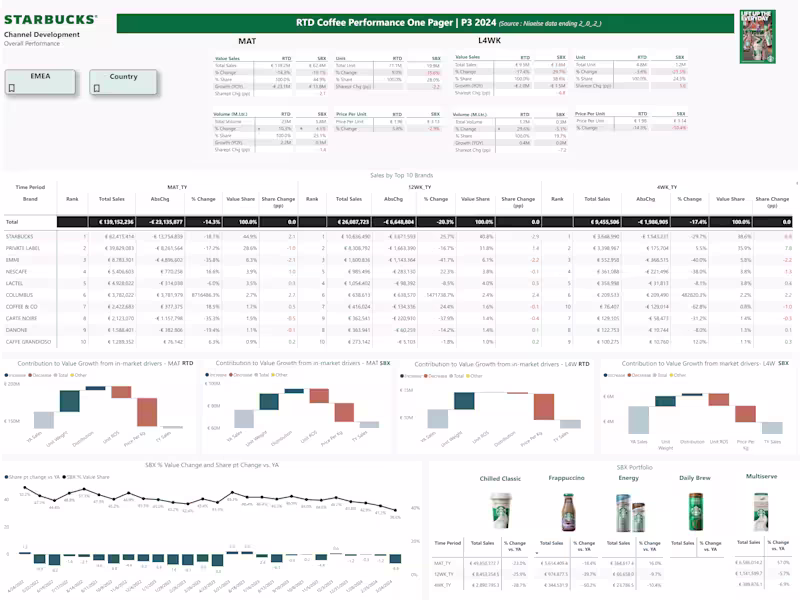
Power BI Dashboard for Starbucks Sales Analysis
1
35
Message
0
Rashmi Lakhera
pro
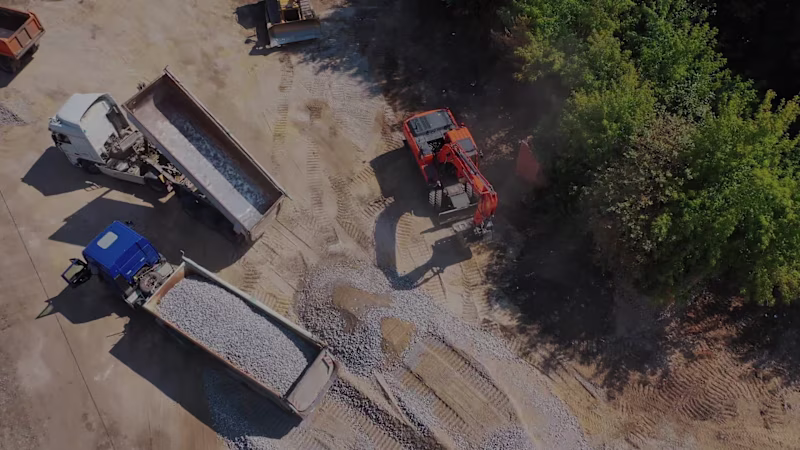
Produced this high-energy promotional video for HestaBit’s GeoVista-AI platform, designed specifically for exhibition at GITEX Global 2025. The video seamlessly blends 3D data visualization, dynamic terrain modeling, and sleek UI motion graphics to communicate complex AI-driven mining solutions. By turning abstract subsurface data into an engaging visual narrative, this piece showcases my ability to craft premium, event-ready product explainers that capture attention and elevate enterprise tech brands.
0
111
Message
0
Mandar Chaudhari
pro
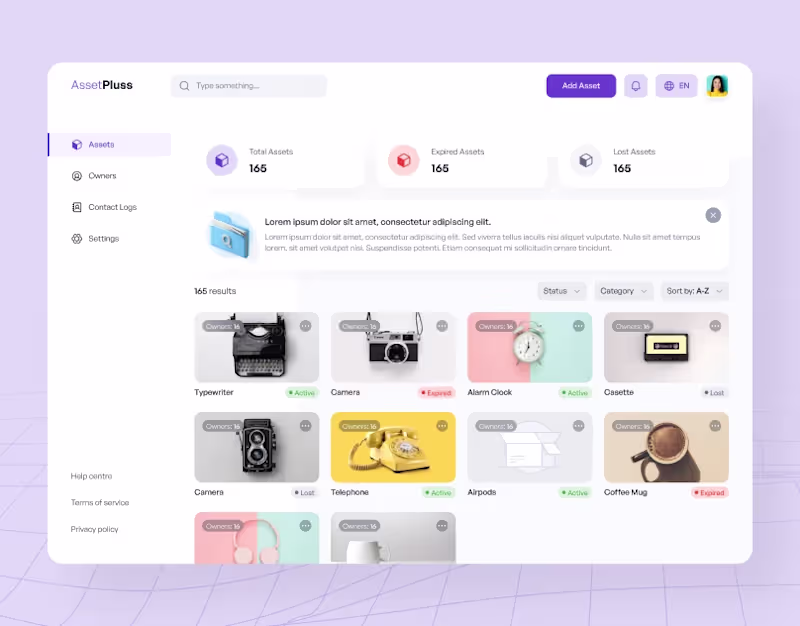
AssetPluss
0
3
Message
0
Ansh Agrawal
pro
[Case Studies] How I helped startups with product growth
0
41
Message
3
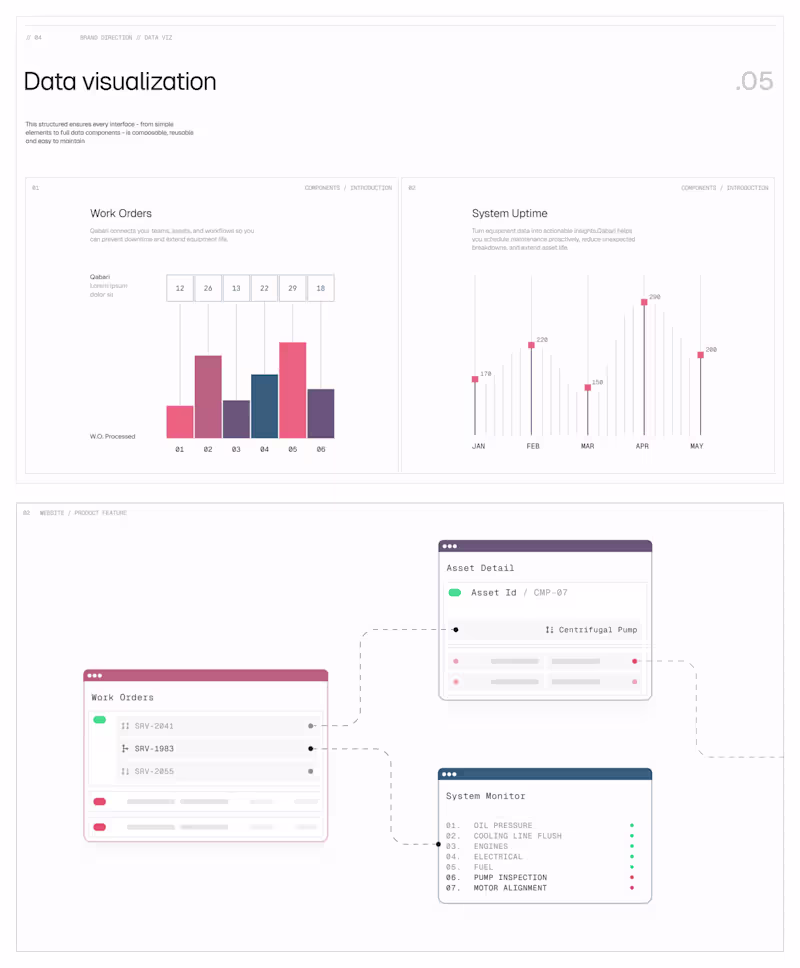
Dante .
Data Visualisation // Product Features
3
86
Message
1
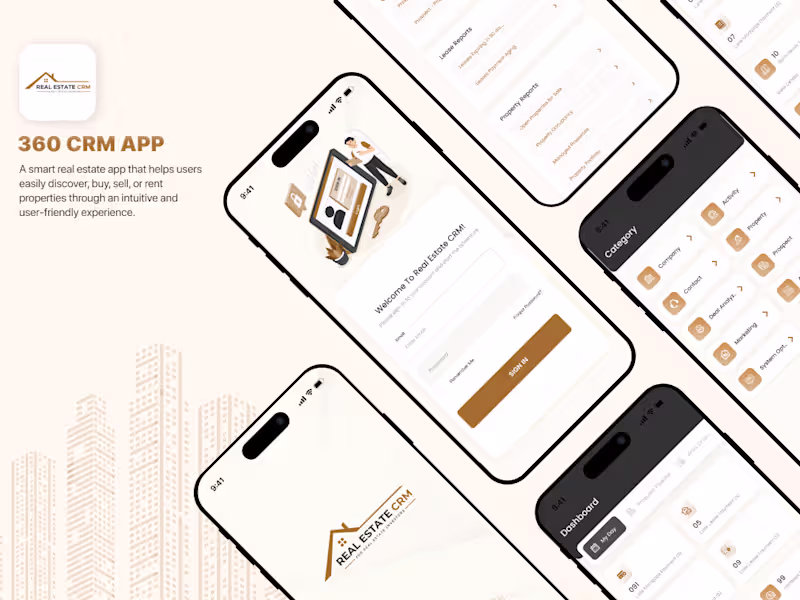
Tarang Patel
pro
Viqsa 360 Real Estate CRM UI/UX Design
1
4
Message
0
Varad Parulekar
Data so clean it could pass a background check
0
92
Message
0
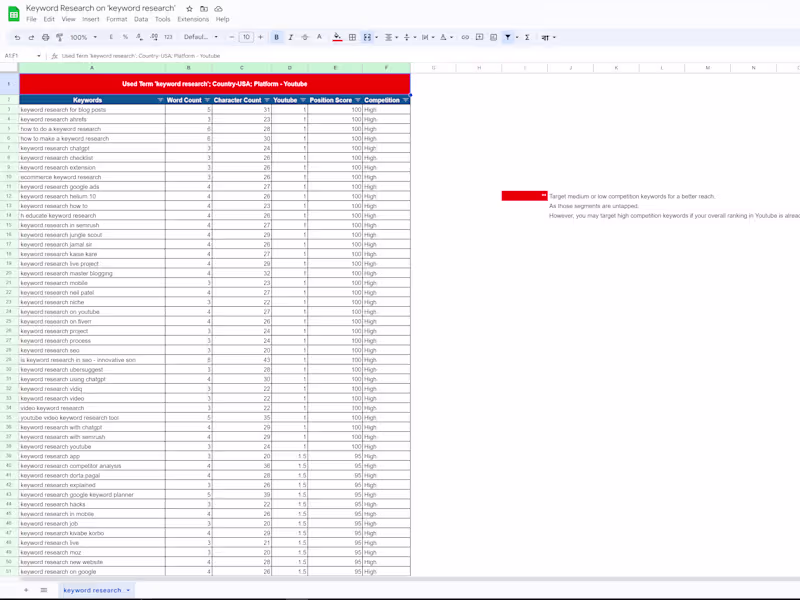
Snehashis Chaki
pro
Keyword Research for optimizing search results - Mockups 🔍
0
10
Message
1
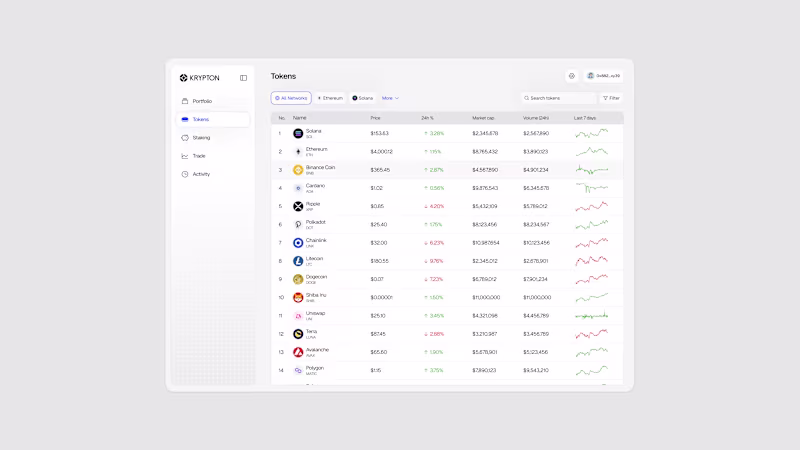
harshad p
this crypto dashboard doesn’t just look good
1
226
Message
0
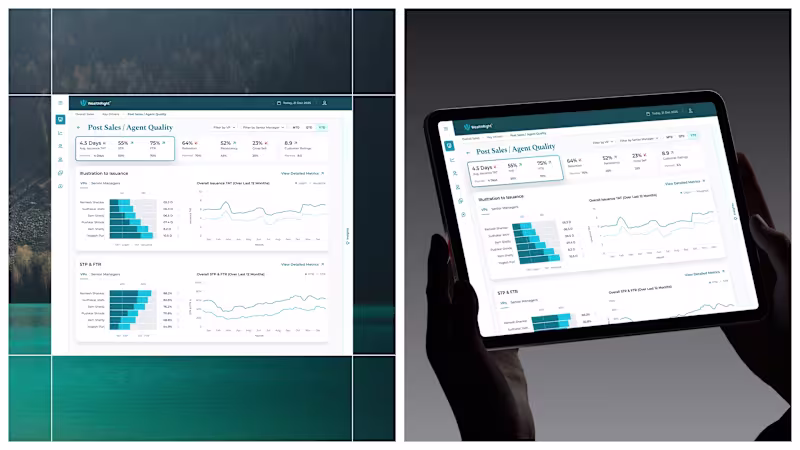
Rinkesh Chopada
pro
CRM and HRMS Dashboard | UI/UX Design
0
166
Explore projects
![Cover image for [Case Studies] How I helped startups with product growth](https://media.contra.com/image/upload/q_auto,w_800/uxiibfbxkk1up1hgpv6k.avif)