Data Analysis Projects in Hyderabad
Data Analysis Projects in Hyderabad
Sign Up
Post a job
Sign Up
Log In
Filters
2
Projects
People
Message
0
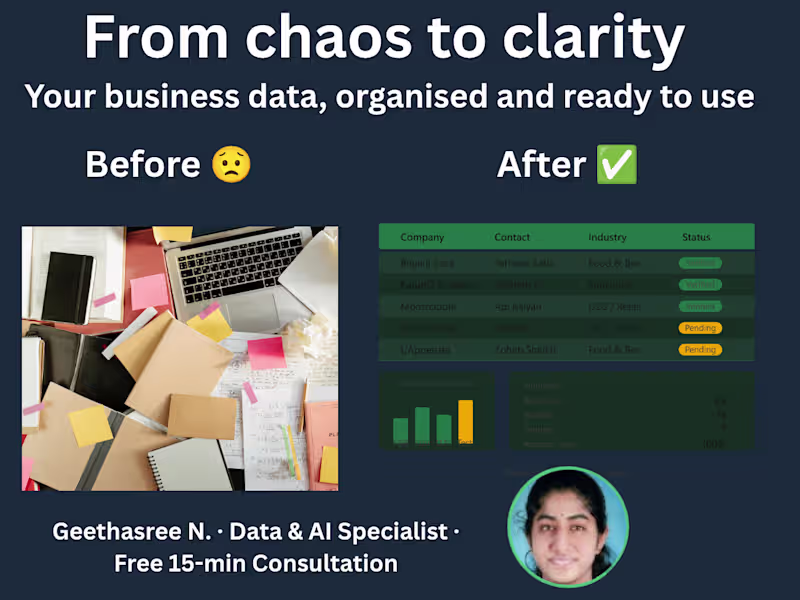
Geethasree Naguboina
pro
Most small business owners I talk to have the same problem — their data is scattered across WhatsApp messages, paper notes, and half-filled Excel sheets. They know something is wrong. They just don't know where to start. Here's what I do in the first 30 minutes of any project: ✅ Understand what data you have and where it lives ✅ Identify what's missing, duplicate, or inconsistent ✅ Suggest the simplest structure that works for your business No complicated tools. No jargon. Just clean, organised data you can actually use. If your business data feels messy and overwhelming — let's fix that together. Message me and we'll start with a free 15-minute consultation. 📊
0
18
Message
1
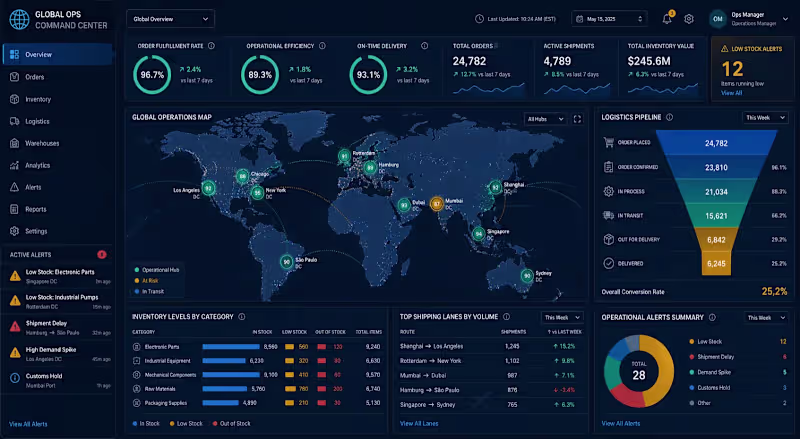
Mujtaba Quadri
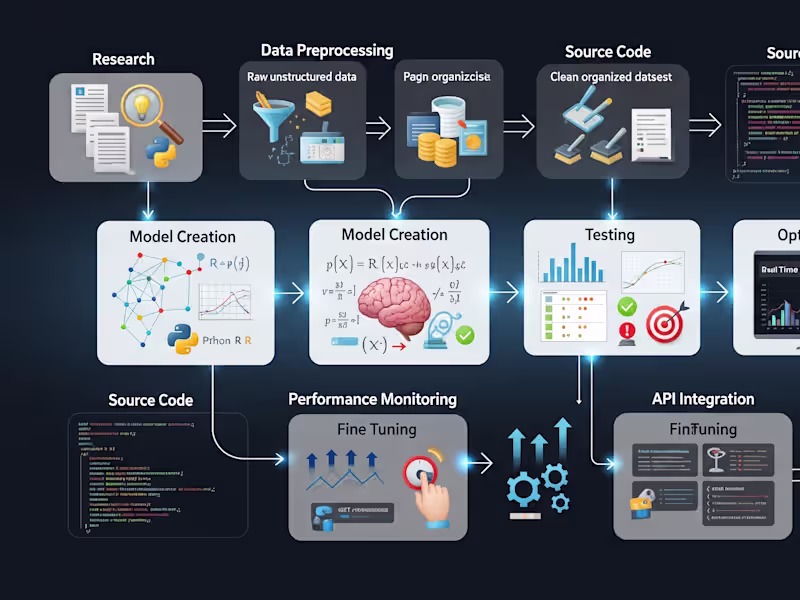
This Project Focused On The Architecture Of A Dynamic Operational Command Center Designed To Optimize Global Supply Chain Logistics And Inventory Management. By Integrating Multi-Source Data Streams Using Advanced SQL Querying, The System Provides Real-Time Visibility Into Key Performance Indicators Such As Order Fulfillment Latency, Inventory Turnover Ratios, And Regional Delivery Success Rates. Utilizing Sophisticated Data Visualization Techniques, The Dashboard Empowers Stakeholders To Identify Logistics Bottlenecks And Streamline Warehouse Operations. The Implementation Of Automated Trend Analysis Facilitated A Significant Reduction In Stock-Out Incidents And Enhanced Overall Operational Efficiency By Providing Granular Insights Into The End-To-End Supply Chain Lifecycle.
1
59
Message
0
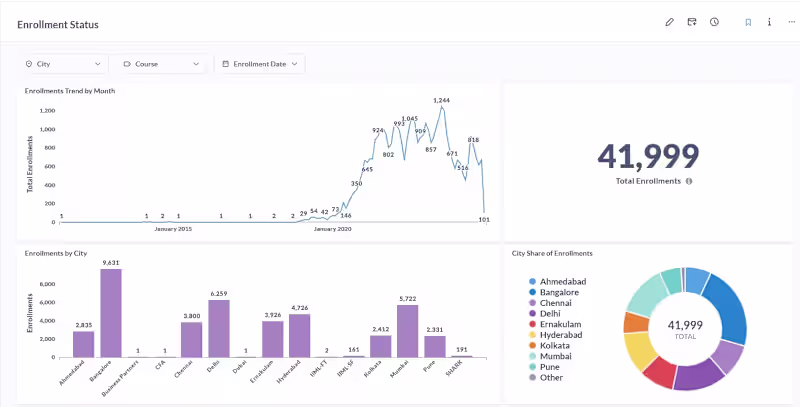
Krishna Chaitanya Mukundala
Metabase Dashboards for Edtech
0
17
Message
0
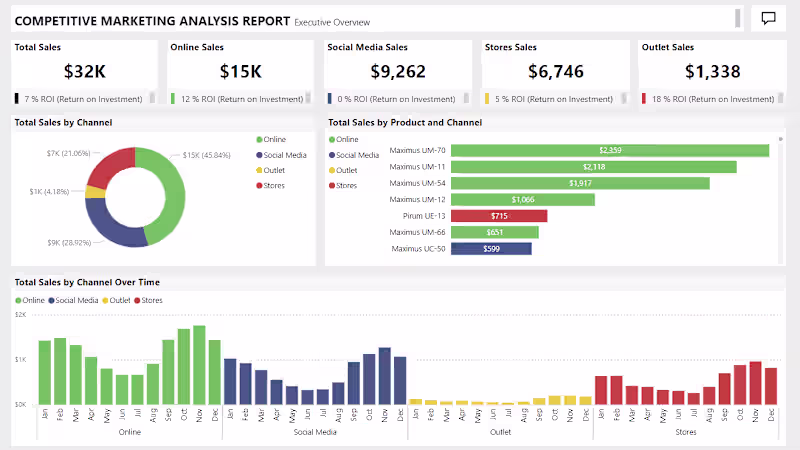
Rakesh Ranjan
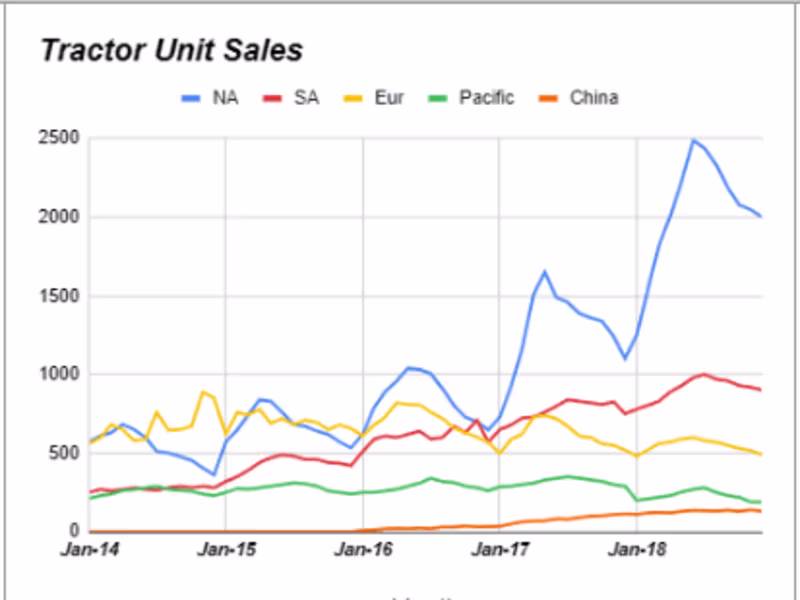
Sales Channel Analysis
0
2
Message
0
Varshith Gaddam
Stock Analysis Project with AutoGen
0
3
Message
0
Naga Sai
Fifa20
0
21
Message
0
Yedla Naga Sathvik
Walmart Sales Data Analysis
0
2
Message
0
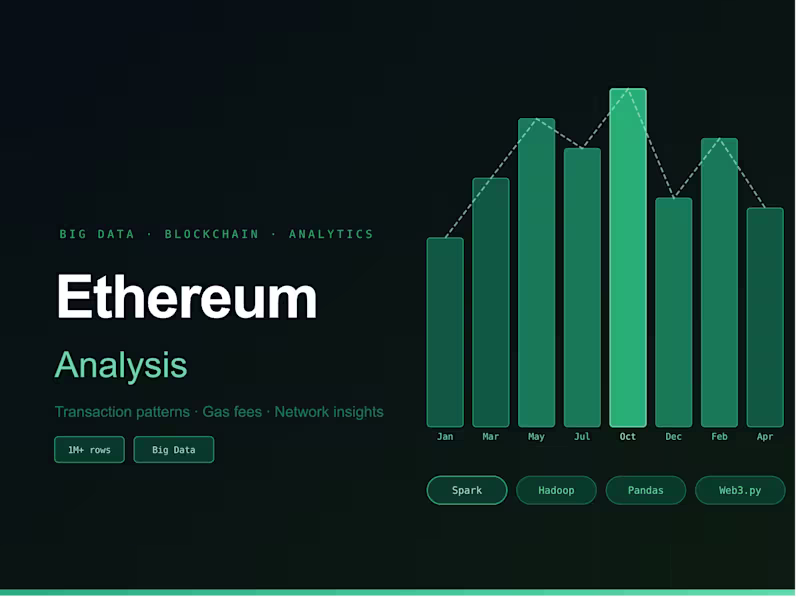
Gitesh Deshmukh
Big-Data-Ethereum-Analysis
0
1
Message
0
Shaik Nawaz
Credit-Card-Fraud-Detection
0
2
Message
0
Ajith Kategar
Starclap
0
12
Message
0
Kaushik Chetlur
CaseStudy_PerformanceLawnEquipment: Dashboard
0
0
Message
0
Jayanthi Ambala
Streamlined Network Performance Audits
0
0
Message
0
Vikas Devarakonda
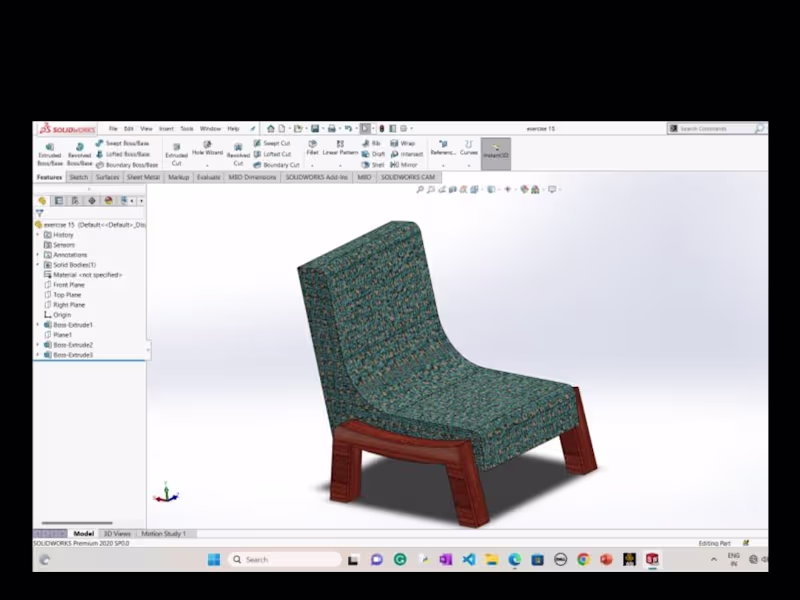
Designing and Architecture.
0
0
Message
0
MOHAMMED ABDUL RAFAY IMRAN KHAN
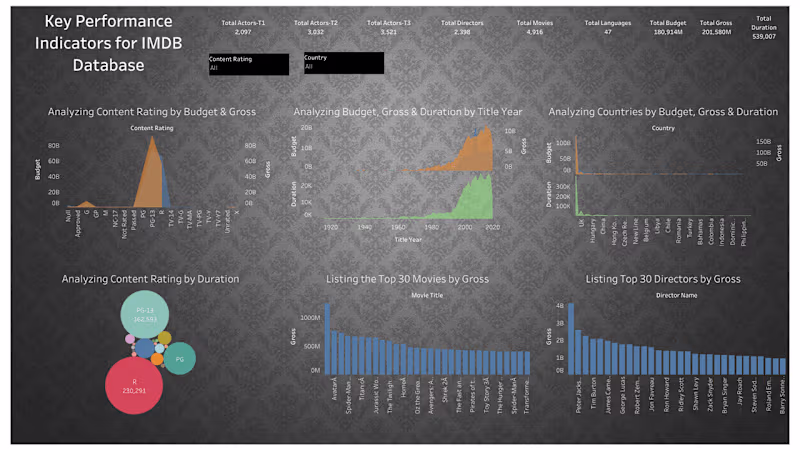
Data Analysis of IMDB KPI's
0
0
Message
1
Jason Jason
Feature Suggestion Report – Fitness Tracker MVP
1
0
Message
0
Venkata surya Abbur
GitHub - SuryaDataSci/Stable_Diffusion_AI: “Developed an AI-bas…
0
1
Explore projects