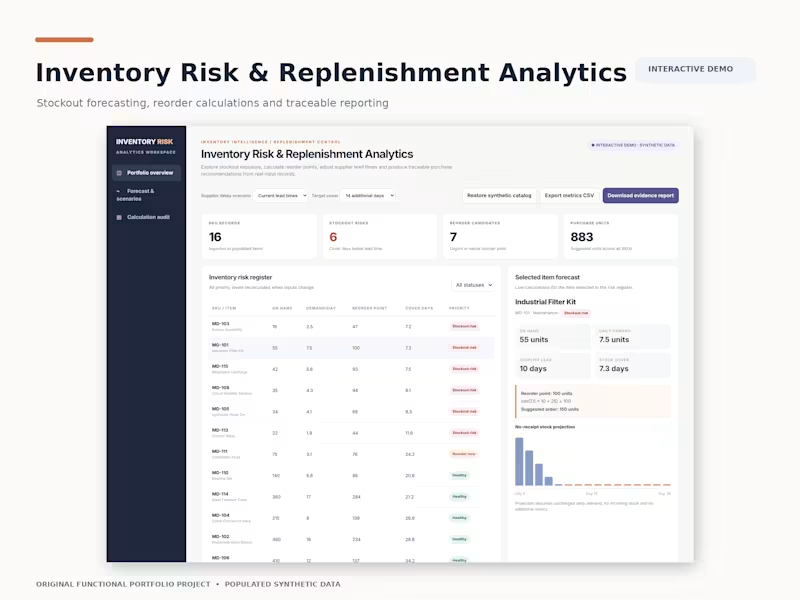
This video demonstrates an interactive inventory analytics application designed to help operations teams monitor stock availability, identify supply shortages, and make informed replenishment decisions.
Using 16 populated synthetic inventory records, the walkthrough demonstrates how changes in stock quantities and supplier lead times automatically update inventory risk calculations.
What the Video Demonstrates
Inventory Dashboard: Displays stock availability, six stockout-risk items, and seven replenishment candidates.
Stockout Risk Detection: Identifies products that may run out before replacement inventory arrives.
Supplier Delay Simulation: Demonstrates how changing lead times affects replenishment calculations and risk exposure.
Interactive Inventory Management: Shows how stock adjustments immediately update dashboard metrics.
Replenishment Analytics: Calculates reorder points using demand, lead time, and safety stock.
Reporting: Provides calculated inventory results and export capabilities.
Technical Implementation
Developed the interactive dashboard, inventory calculation logic, scenario controls, risk filtering, and data import/export functionality using JavaScript, HTML5, and CSS3.
The demonstration showcases a functional inventory management analytics application with reproducible calculations and clearly identified synthetic data.
2
0
39



Workforce Scheduling & Capacity Planner | Interactive Demo
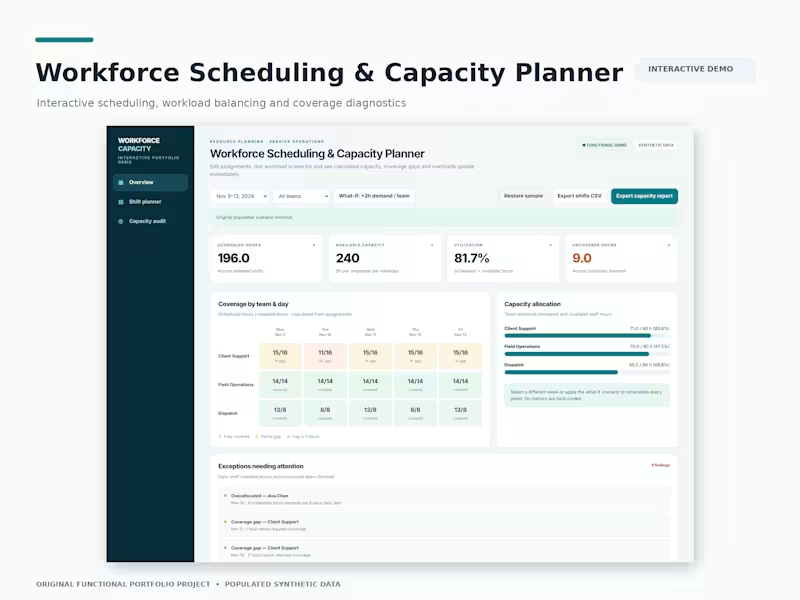
This video demonstrates a desktop-optimized workforce scheduling application designed to help operations teams manage staff assignments, monitor capacity, and identify coverage gaps.
Using populated synthetic workforce data, the walkthrough shows how scheduling changes automatically recalculate staffing availability and operational performance metrics.
What the Video Demonstrates
Workforce Capacity Dashboard: Displays 196 scheduled hours, 240 available hours, and 81.7% workforce utilization.
Interactive Shift Management: Demonstrates adding staff assignments and automatically recalculating capacity metrics.
What-If Scenario Planning: Simulates increased staffing demand, raising uncovered hours from 9 to 33.
Multi-Dimensional Coverage Analysis: Displays staffing requirements across departments and weekdays using interactive coverage grids.
Capacity Auditing: Identifies staffing shortages, employee overallocations, and operational exceptions requiring attention.
Technical Implementation
Application Logic: Developed interactive state management that updates dashboard calculations when assignments, reporting periods, or staffing requirements change.
Data Processing: Implemented calculations comparing scheduled staffing hours against available capacity and departmental demand.
Data Management: Built CSV import/export functionality, input validation, and downloadable capacity reports.
Technology: JavaScript, HTML5, and CSS3.
The demonstration showcases a functional workforce planning application with traceable calculations and interactive scenario analysis.
0
18